首页 BLOG Cost Structure, Profit Model, and 6-Month Payback Strategy for Commercial Fully Automatic Ice Cream Machines
Cost Structure, Profit Model, and 6-Month Payback Strategy for Commercial Fully Automatic Ice Cream Machines
Date:2026-01-13 Author:Huaxin
This article aims to provide catering operators and investors with an objective investment analysis report on commercial fully automatic ice cream machines. By breaking down the total cost of ownership (TCO) of the equipment, constructing a profit model based on industry data, and elaborating on key operational strategies, the report clearly demonstrates how this equipment can achieve cost recovery within 6 months in typical scenarios and continuously generate additional profits of several thousand euros per month.

In the current catering industry landscape, the introduction of high-value-added automated equipment has become one of the key paths to enhancing profitability. As a representative product in this category, the commercial fully automatic ice cream machine’s value lies not only in ice cream production but also in its potential as an independent profit center. This article will analyze its true investment return prospects based on objective data.
Comprehensive Cost Structure Analysis
Investment decisions begin with a clear understanding of the total cost of ownership. The cost composition of a commercial fully automatic ice cream machine is as follows:- Initial Investment Cost:
Additional costs include transportation, installation, and optional accessories, which typically account for 5%-10% of the equipment price.
- Recurring Operating Costs:
Raw Material Costs: These include ice cream premix powder, cones, paper cups, etc. Calculated based on a standard 60g serving per cup, the raw material cost per cup can be controlled between 0.3 and 0.5 euros.
Maintenance Costs: Equipment with a modular design features separate electrical control systems and refrigeration systems, which simplifies daily maintenance and fault repair, effectively reducing long-term maintenance expenses.
Key Insight: The reference frame for initial investment should be the long-term labor costs and efficiency losses it can replace, rather than just the equipment’s marked price.
Data-Based Profit Model Construction
Basic Parameter Settings:Standard serving per cup: 60g
Recommended retail price: 3 euros per cup (this is a conservative estimate; specialty products can be priced higher)
Average daily sales volume: 50 cups (a conservative estimate based on stores with moderate customer flow)
Daily and Monthly Revenue Calculation:
Daily gross revenue = 50 cups × 3 euros/cup = 150 euros
Daily raw material cost = 50 cups × 0.4 euros/cup = 20 euros
Daily gross profit = 150 euros - 20 euros = 130 euros
Monthly gross profit = 130 euros × 30 days = 3,900 euros
Monthly net profit (after deducting electricity costs) = 3,900 euros - 120 euros = 3,780 euros
This calculation result aligns with the industry case of "an additional monthly income of 2,700 euros," and this model adopts a more conservative sales volume estimate.
Core Operational Strategies to Improve ROI
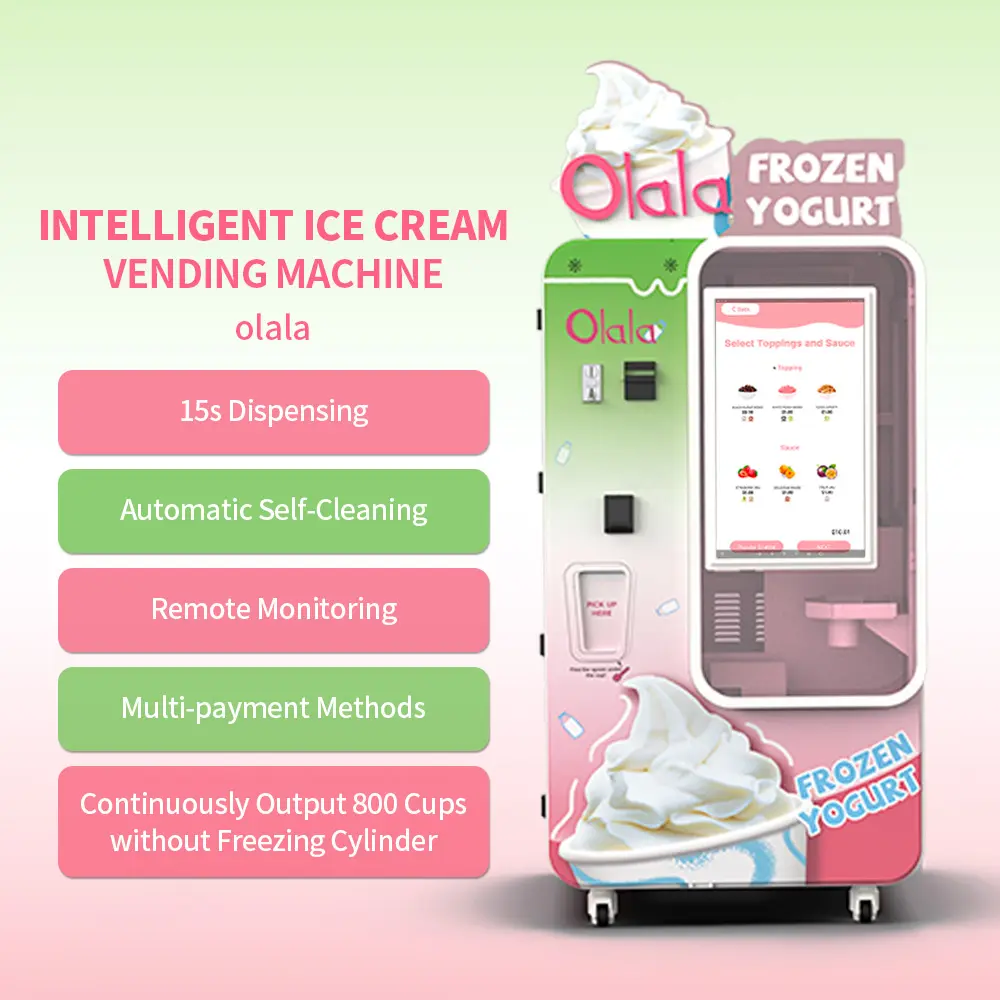
Maximize Space Value: Leveraging the equipment’s compact size and top exhaust design, it can be moved from the back kitchen to the front desk or bar counter. This traetlorms the visual appeal of the machine in operation into consumer attraction, effectively increasing impulsive purchase rates. Data shows that displaying the machine at the front desk can boost sales by 20% or more.Optimize Product Value and Pricing: Using the equipment’s functions such as multiple latte art designs and freezing curve adjustment, it is easy to launch differentiated products (e.g., specialty latte art ice cream, milkshakes, smoothies). Differentiated products support a premium pricing strategy, allowing the price per cup to be increased to 3.5-4 euros, directly raising the average transaction value and profit margin.
Digitalization and Automation of Operation Management: The integrated module supports remote monitoring, sales statistics, and status alert functions, significantly reducing the labor and time costs required for daily management. Managers can achieve unified management of equipment across multiple stores and allocate human resources to higher-value positions.
Risk Considerations and Investment Applicability
Risk Warning:For stores with a long-term average daily natural customer flow of less than 80 people, the investment payback period may be extended. It is recommended that such stores first verify local market demand by means of short-term leasing or cooperative sharing with nearby businesses.
Recommended Application Scenarios:
Cafés and Fast-Food Restaurants: The most suitable scenario. They can leverage existing customer flow to achieve cross-selling, resulting in the shortest investment payback period.
Emerging Ice Cream Brands/Stores: Should prioritize models with stable production and remote management functions to achieve efficient operations with a minimal team size in the early stage of entrepreneurship.
Data analysis shows that in a store with low-to-moderate customer flow, a commercial fully automatic ice cream machine is expected to recover its cost within 6 months. Its core value lies in converting fixed labor costs into controllable equipment investment, and through high efficiency, low failure rates, and intelligent management, building a predictable and sustainable profit source. The final decision should be based on the investor’s accurate assessment of their own customer flow, operational capabilities, and market positioning.