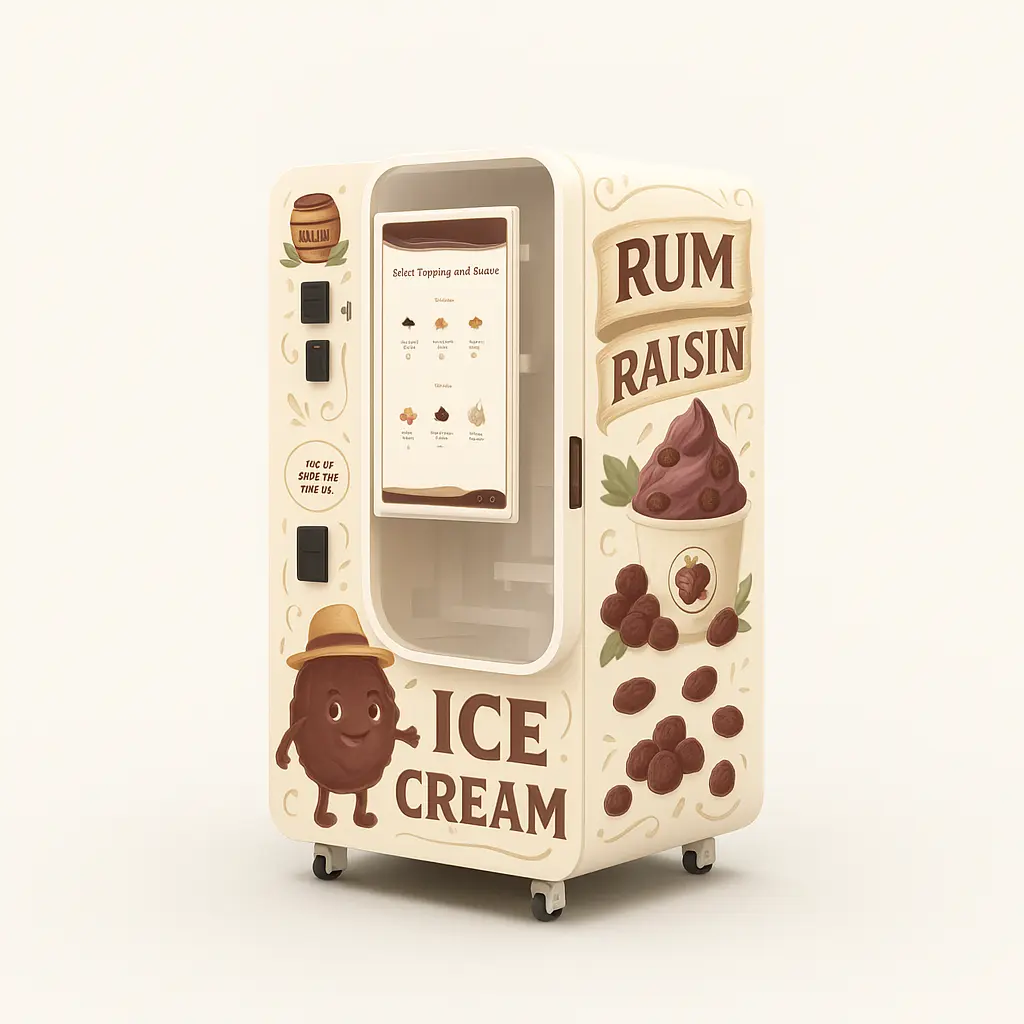
Ice Cream Vending Machine Operating, Maintenance and Ingredient Costs: Full Budget Guide
Calculate the real operating cost of an ice cream vending machine, including ingredients, electricity, cleaning, labor, maintenance, payment fees, site costs and spare parts

The ice cream vending machine operating cost begins after the equipment has been purchased, imported and installed. It includes the ingredients used in every serving, but it also includes electricity, cups, toppings, cleaning materials, payment fees, refill labor, site costs, maintenance and the financial effect of downtime.
These expenses are easy to underestimate because they do not appear as one large invoice. Instead, they accumulate through small daily purchases, weekly service visits, monthly fees and occasional repairs.
A buyer comparing machine quotations may spend weeks analyzing a difference of several hundred dollars in equipment price while paying far less attention to the costs that will repeat throughout the machine’s operating life.
For that reason, a complete total cost of ownership model should separate operating expenses into five groups:
- Product and packaging costs
- Electricity and connectivity
- Refilling, cleaning and labor
- Maintenance and spare parts
- Location and payment-related expenses
The purpose of this guide is not to promise a universal cost per cup. Ingredient prices, wages, electricity tariffs and rent vary too widely between countries and locations. Instead, it provides a framework that operators can fill with their own figures before ordering a machine or expanding to additional sites.
The Full Operating Cost Framework
Operating costs can be divided into variable costs and fixed or semi-fixed costs.
Variable costs generally rise as sales increase. These include mix, cups, spoons, toppings and payment transaction fees.
Fixed and semi-fixed costs may continue even during a slow month. These can include site rent, connectivity, software, scheduled cleaning labor and a maintenance reserve.
A useful operating formula is:
Monthly operating cost = Product consumables + Electricity + Payment costs + Refill and cleaning labor + Site costs + Connectivity + Maintenance reserve
The cost allocated to each serving can then be calculated as:
Operating cost per cup = Total monthly operating cost ÷ Number of cups sold
This calculation should not be confused with profit. It excludes or separates equipment depreciation, tax, financing and the original machine investment unless the operator intentionally adds them to the model.
| Cost Category | Typical Items | Cost Behavior |
|---|---|---|
| Ingredients | Soft serve mix, frozen yogurt, sorbet or açaí-style base | Mostly variable |
| Serving consumables | Cups, spoons, lids, napkins | Variable |
| Toppings | Granola, nuts, dry fruit, sauces and jam | Variable |
| Electricity | Refrigeration, freezing, screen and controls | Semi-variable |
| Labor | Refilling, cleaning, travel and inspections | Semi-fixed |
| Payment | Transaction fees, terminal rental and settlement | Variable or monthly |
| Connectivity | SIM card, data plan or software | Usually fixed monthly |
| Site | Rent, minimum guarantee or revenue share | Fixed or sales-linked |
| Maintenance | Wear parts, local service and spare-parts shipping | Irregular |
| Waste | Discarded mix, damaged cups and expired toppings | Variable |
The most accurate model uses measured operating data rather than supplier claims or general online averages.
1. Ingredient Cost: Calculate the Recipe, Not Just the Bag Price
The ingredient is usually one of the largest direct costs in each serving. However, the purchase price of one bag, carton or tub does not tell the operator the real cost per sale.
The calculation must include:
- Purchase price
- Delivery cost
- Preparation ingredients such as water or milk
- Expected yield
- Portion size
- Product remaining after cleaning
- Waste or spoilage
- Recipe testing
- Toppings and sauces
A practical formula is:
Base ingredient cost per cup = Total prepared-batch cost ÷ Number of saleable cups produced
The phrase “saleable cups” matters. A theoretical recipe may produce 100 portions, but the operator may only sell 94 after accounting for testing, cleaning loss, overfilling and unused product.
Public Soft Serve Mix Example
Current public foodservice listings illustrate how the calculation can begin, although they should not be treated as universal market pricing.
One U.S. foodservice retailer listed a six-case pack of non-dairy vanilla soft serve mix at USD 82.95 and a comparable chocolate case at USD 100.95. Each case contains six bags. A product listing for the same 6 lb mix states that each bag yields approximately 88 two-thirds-cup servings. Based only on those published figures, the nominal dry-mix cost would be approximately USD 0.16–0.19 per listed serving before water, delivery, waste, cups and toppings are included.
That calculation is useful as a method, not as a purchasing benchmark. A vending-machine portion may not match the supplier’s stated serving size, and prices can differ substantially by country, contract quantity and local distribution.
Ingredient Differences by Product Type
Soft Serve
Soft serve can use liquid or powdered formulations. Operators should compare:
- Cost per prepared liter
- Yield per cup
- Dairy or non-dairy requirements
- Local storage and shelf life
- Water or milk quality
- Cleaning loss
A shelf-stable powder may simplify storage, while a refrigerated liquid mix may provide a different recipe and logistics profile.
Frozen Yogurt
Frozen yogurt cost depends on:
- Dairy content
- Culture and formulation
- Sugar level
- Local cold-chain requirements
- Premium positioning
- Topping strategy
The base cost may be similar to or higher than conventional soft serve, but toppings often create the larger cost difference.
Sorbet
Fruit-based sorbet mixes may be dairy-free, but they are not automatically cheaper. Fruit concentrate, flavor type and imported ingredients can raise costs.
Operators also need to confirm that the recipe freezes and dispenses consistently in the selected machine.
Açaí-Style Frozen Dessert
Açaí-style products are often positioned as premium menu items. Their cost structure may include:
- Imported or concentrated açaí ingredients
- Frozen or refrigerated logistics
- Granola
- Nuts
- Dry fruit
- Sauces or jam
- Higher product waste if demand is inconsistent
A public U.S. foodservice listing, for example, offers commercial açaí sorbet in a 3-gallon tub, demonstrating that this category may use a different purchasing and storage model from powdered soft serve mix.
Huaxin machines normally use one base product at a time. Switching between soft serve, frozen yogurt, sorbet and açaí-style menus requires changing the base material and adjusting the recipe rather than running several unrelated bases simultaneously.
2. Cups, Spoons and Toppings
Packaging is easy to overlook because the unit price appears small. Across thousands of servings, however, a difference of several cents per cup becomes significant.
A current U.S. foodservice listing priced 6 oz paper frozen-yogurt cups at approximately USD 0.07–0.08 each in cases of 1,000, before lids, spoons, branding and delivery. That figure is only a public retail reference; local wholesale pricing may be different.
Operators should confirm:
- Exact cup dimensions
- Rim diameter
- Cup rigidity
- Compatibility with the storage and dispensing system
- Minimum order quantity
- Printing or branding cost
- Local lead time
- Defect rate
A cheap cup that feeds unreliably can cost more through jams, refunds and site visits.
Topping Cost
Toppings should be calculated using an average portion, not the purchase price of the container.
For each topping, record:
Cost per serving = Pack cost ÷ Number of controlled portions
Free-pour topping systems often create unpredictable cost. Portion-controlled dispensers and clear recipes make budgeting more reliable.
Operators should also separate standard toppings from premium additions. Granola and basic sauce may fit the standard menu, while premium nuts or specialty fruit could require a surcharge.
3. Electricity Cost: Measure Actual Consumption
A vending machine’s rated electrical power is not the same as its continuous energy consumption.
The compressor, refrigeration system, screen, lights, controls and communication equipment cycle at different times. Actual consumption can be affected by:
- Ambient temperature
- Ventilation
- Number of servings
- Door or service-panel opening
- Product temperature
- Cleaning cycles
- Refrigeration settings
- Machine condition
- Screen brightness
- Standby behavior
The correct formula is:
Daily electricity cost = Measured daily kWh × Local commercial electricity tariff
The best method is to measure the machine with a suitable energy meter during representative operation. One quiet test day is not enough for a high-traffic location.
Current Tariff Context
The U.S. Energy Information Administration reported an average commercial electricity price of 13.79 cents per kWh for January through May 2026. Individual states and utility tariffs varied considerably.
Eurostat reported an EU average non-household electricity price of EUR 18.37 per 100 kWh in the second half of 2025 for the consumption band covered by its release. Country figures ranged from EUR 7.48 per 100 kWh in Finland to EUR 25.52 in Ireland.
These figures should not be inserted directly into every project model. A small operator may pay a different tariff, and a mall may add an electricity or facility charge.
Electricity Calculation Example
Assume a machine records 16 kWh per day and the local commercial tariff is USD 0.14 per kWh:
- Daily electricity: 16 × USD 0.14 = USD 2.24
- Thirty-day electricity: USD 67.20
- At 1,800 monthly cups: approximately USD 0.04 per cup
This is an illustrative calculation only. It is not a Huaxin energy-consumption guarantee.
4. Refilling, Cleaning and Labor
Automatic vending reduces the need for continuous counter staff. It does not remove labor entirely.
Every operating plan should include time for:
- Travel
- Site access
- Ingredient replenishment
- Cup and spoon replenishment
- Topping refill
- Cleaning
- Waste removal
- Visual inspection
- Fault checking
- Recording inventory
- Customer-support follow-up
The real labor cost is not limited to the time spent standing in front of the machine.
A more accurate formula is:
Service-visit cost = Travel time + On-site labor + Transport cost + Access or parking cost
Labor Cost Context
The U.S. Bureau of Labor Statistics reported a May 2025 national mean hourly wage of USD 17.86 and a median of USD 16.85 for food preparation and serving-related occupations. Employer cost may be higher after payroll taxes, insurance, training, scheduling and supervision are included.
Eurostat estimated average whole-economy hourly labor costs of EUR 34.90 in the EU during 2025, with wide differences between countries. It also reported that non-wage costs represented 24.8% of total labor cost in the EU. This is a broad employer-cost reference rather than a vending-service wage benchmark.
Operators should use their own loaded labor cost, not only an employee’s basic hourly wage.
Why Route Density Matters
A machine located near the operator’s warehouse may be inexpensive to service. A machine in another city can create substantial travel time even if it only needs 30 minutes of on-site work.
For multi-location operations, record:
- Distance between machines
- Expected refill frequency
- Access hours
- Parking restrictions
- Whether several machines can be serviced on one route
- Emergency response distance
Remote management can reduce unnecessary inspection visits by showing sales, machine status, temperature or fault information. It cannot eliminate visits required for physical refilling and sanitation.
5. Cleaning and Food-Safety Costs
Cleaning is both an operating task and a risk-control process.
The budget may include:
- Cleaning chemicals
- Sanitizer
- Brushes and tools
- Disposable gloves
- Replacement seals
- Waste containers
- Labor
- Water
- Product discarded during cleaning
Cleaning frequency must follow the machine procedure, ingredient requirements and the rules of the operating jurisdiction.
The FDA Food Code is a model used by U.S. jurisdictions for retail food and vending regulation. Its purpose is to support safe food handling and control foodborne-illness risks, but local authorities decide the requirements that apply to a specific operation.
What Self-Cleaning Can and Cannot Do
Automated cleaning, pasteurization or self-cleaning functions can provide value by:
- Standardizing selected cleaning cycles
- Reducing repetitive manual steps
- Supporting temperature control
- Improving operating consistency
- Helping an operator plan service visits
They should not be interpreted as “no cleaning required.”
Manual tasks may still include:
- Cleaning accessible food-contact components
- Wiping the dispensing and pickup areas
- Checking residue
- Cleaning topping systems
- Inspecting seals and tubes
- Emptying waste
- Confirming that the programmed cycle completed correctly
The value of self-cleaning should be measured through time studies and sanitation consistency rather than an unsupported percentage claim.
6. Maintenance and Spare-Parts Cost
Maintenance expenses are irregular. That makes them easy to exclude from the monthly budget.
A machine may operate for several months without a major repair and then require a sensor, pump, seal, payment terminal component or refrigeration service. A zero-maintenance monthly assumption therefore gives a false picture.
A more practical budget includes three maintenance layers.
Routine Wear Items
These may include:
- Seals
- Tubes
- Nozzles
- Food-contact parts
- Cup-handling wear items
- Cleaning accessories
Technical Components
Depending on the fault, replacement or service may involve:
- Sensors
- Relays
- Motors
- Pumps
- Screen components
- Payment hardware
- Refrigeration components
Downtime and Logistics
The part itself may be inexpensive, but downtime can also create:
- Lost sales opportunities
- Customer refunds
- Technician travel
- International courier cost
- Emergency site visits
- Temporary machine removal
Operators should maintain a basic local spare-parts package based on the supplier’s recommendations and the number of machines in operation.
A one-machine pilot may need a compact starter kit. A regional operator should hold a wider range of common parts locally.
7. How Configuration Affects Long-Term Cost
The cheapest configuration is not automatically the cheapest to operate. At the same time, buying every optional feature can create unnecessary capital and maintenance complexity.
| Configuration | Potential Operating Benefit | Possible Cost or Trade-Off |
| Stable refrigeration | Better product consistency and temperature control | Higher initial equipment cost and electricity demand |
| Larger cup capacity | Fewer refill visits | More cabinet space and inventory inside the machine |
| Higher mix capacity | Longer operating periods between refills | Greater waste exposure if demand is low |
| Automated cup handling | More consistent service flow | Additional moving components |
| Remote monitoring | Fewer unnecessary visits and faster fault response | Connectivity or software requirements |
| Automated cleaning functions | More standardized routines and fewer manual steps | Still requires inspection and manual cleaning |
| Multi-payment support | Better customer accessibility | Terminal, network and transaction fees |
| Larger screen | Better visibility and menu presentation | Electricity use and replacement cost |
The correct configuration depends on the location.
A high-volume FEC may benefit from more capacity and stronger alerts. A hotel with moderate demand may prioritize appearance, quiet operation and a simple refill schedule. A remote tourist site may need local spare parts and reliable monitoring more than a complex menu.
8. Illustrative Monthly Operating Budget
The following model is hypothetical. It is not a Huaxin customer result, a profit forecast or a guaranteed operating cost.
Example Assumptions
- 60 cups per day
- 30 operating days
- 1,800 cups per month
- Average selling price used only to calculate payment fees: USD 4.50
- Electricity consumption measured at 16 kWh per day
- Electricity tariff: USD 0.14 per kWh
- Payment fee assumption: 2.9% plus USD 0.10
- Site fee: USD 700 per month
| Cost Item | Monthly Cost | Allocated Cost per Cup |
| Base mix | USD 756.00 | USD 0.42 |
| Cup and spoon | USD 180.00 | USD 0.10 |
| Average toppings | USD 324.00 | USD 0.18 |
| Cleaning consumables | USD 54.00 | USD 0.03 |
| Electricity | USD 67.20 | USD 0.04 |
| Payment fees | USD 414.90 | USD 0.23 |
| Refill labor and travel | USD 300.00 | USD 0.17 |
| Site fee | USD 700.00 | USD 0.39 |
| Connectivity/software | USD 30.00 | USD 0.02 |
| Maintenance reserve | USD 120.00 | USD 0.07 |
| Illustrative monthly total | USD 2,946.10 | Approximately USD 1.64 |
This model excludes the original machine price, financing, income tax and major unforeseen repairs. It also assumes that all 1,800 prepared servings are sold.
The table is useful because each assumption can be replaced:
- Change the cup volume
- Insert the local mix cost
- Enter the real payment rate
- Replace the site fee
- Measure actual electricity
- Record true refill time
- Adjust the maintenance reserve
The goal is not to achieve the example result. The goal is to build a model that reflects the actual project.
9. Practical Ways to Control Long-Term Cost
Match Capacity to Real Demand
Oversized ingredient capacity can increase waste in a slow location. Insufficient capacity can create excessive refill trips in a busy location.
Use realistic daily and peak-hour demand estimates.
Measure Waste
Record:
- Mix loaded
- Cups produced
- Product discarded
- Damaged cups
- Topping loss
- Cleaning loss
Without this information, an operator may believe ingredient cost is stable while unexplained waste is increasing.
Standardize Portion Size
Small changes in portion size affect hundreds or thousands of servings. Recipe settings and topping portions should be consistent.
Build Efficient Service Routes
Group nearby machines into one refill route. Use remote data to prioritize machines that actually need attention.
Hold Common Spare Parts Locally
A low-value part should not create several weeks of downtime. The spare-parts plan should grow with the number of machines.
Compare Sites Using Contribution, Not Revenue Alone
A high-revenue machine may also have high rent, labor or topping costs. Compare locations after direct operating expenses.
Review Costs Monthly
Electricity, ingredients, labor and payment fees change over time. Update the model rather than relying permanently on launch assumptions.
Operating and Maintenance Checklist
Daily or Remote Review
- Check machine online status
- Review temperature and fault alerts
- Review unusual refund or payment activity
- Check estimated cup and ingredient levels
- Confirm the site has not reported a cleanliness issue
Scheduled Service Visit
- Refill base product
- Refill cups and spoons
- Refill toppings
- Clean the dispensing area
- Clean the pickup area
- Inspect food-contact parts
- Check seals, tubes and moving components
- Remove waste
- Record stock used
- Record cleaning completion
Weekly or Periodic Review
- Compare ingredient usage with cups sold
- Check product waste
- Review electricity readings
- Review service time and travel cost
- Inspect spare-parts stock
- Check payment settlement
- Compare location expenses
- Review recurring fault codes
Monthly Cost Review
- Ingredient cost per cup
- Packaging cost per cup
- Topping cost per cup
- Electricity per cup
- Payment cost per cup
- Service labor per cup
- Site cost per cup
- Maintenance reserve
- Total operating cost per cup
Operating Budget Template
Country:
Currency:
Location Type:
Number of Machines:
Expected Daily Cups:
Operating Days per Month:
Product Type: Soft Serve / Frozen Yogurt / Sorbet / Açaí-Style
Cup Size:
Base Mix Cost per Batch:
Saleable Cups per Batch:
Calculated Mix Cost per Cup:
Cup and Spoon Cost:
Average Topping Cost:
Cleaning Consumables per Cup:
Estimated Waste Percentage:
Measured Daily Electricity Consumption:
Commercial Electricity Tariff:
Monthly Electricity Cost:
Service Visits per Week:
Average Travel Time per Visit:
Average On-Site Time per Visit:
Loaded Labor Cost per Hour:
Monthly Transport Cost:
Monthly Site Rent or Revenue Share:
Payment Fee:
Monthly Connectivity or Software Fee:
Monthly Maintenance Reserve:
Other Operating Costs:
Estimated Monthly Cups:
Estimated Monthly Operating Cost:
Estimated Operating Cost per Cup:
FAQ
How much electricity does one ice cream vending machine use per day?
There is no reliable universal figure because consumption depends on the machine, ambient temperature, refrigeration cycle, sales volume, screen settings and cleaning operation. Measure actual kWh under representative conditions and multiply it by the local tariff.
How should ingredient cost per cup be calculated?
Add the total cost of the prepared batch, including mix, water or milk and delivery, then divide it by the number of saleable cups. Use actual yield after waste rather than the recipe’s theoretical maximum.
Does self-cleaning eliminate manual cleaning labor?
No. Automated functions can standardize selected cycles and reduce manual steps, but operators still need inspections, exterior cleaning, accessible food-contact cleaning and compliance with local sanitation requirements.
How often should the machine be maintained?
Daily cleaning, periodic inspection and component replacement follow different schedules. The correct frequency depends on the product, machine instructions, sales volume and local food-safety rules.
How much should be reserved for maintenance?
There is no universal percentage. A practical reserve should consider the number of machines, local technician availability, spare-parts lead time and the financial effect of downtime.
Is frozen yogurt more expensive to operate than soft serve?
It can be, but not always. The answer depends on the formulation, local dairy pricing, portion size, topping strategy, waste and storage requirements.
How does remote management reduce operating cost?
It can reduce unnecessary visits, identify faults earlier and help prioritize refilling. It does not replace physical cleaning, ingredient loading or repairs.
What information is needed for a personalized operating-cost estimate?
Provide the country, location type, machine quantity, product type, expected daily sales, cup size, topping plan, local ingredient price, electricity tariff, labor cost, site fee and payment requirements.
Conclusion: Operating Cost Determines the Long-Term Budget
The ice cream vending machine operating cost is not one fixed monthly fee. It is the combined effect of ingredients, packaging, electricity, labor, cleaning, payments, site charges, maintenance and waste.
The most important cost drivers are often not the most visible ones.
A small increase in mix waste, an inefficient refill route or an unsuitable site agreement can have a larger long-term effect than a minor difference in the original machine price. By contrast, a suitable capacity, reliable remote monitoring and a practical spare-parts plan can reduce unnecessary visits and downtime.
Commercial buyers should build the operating model before finalizing the configuration.
For a more relevant budget recommendation, provide:
- Country
- Location type
- Expected machine quantity
- Product category
- Expected daily cup volume
- Payment requirements
- Local electricity tariff
- Ingredient sourcing plan
- Planned launch date
This information allows the supplier and operator to discuss the actual operating model rather than relying on a generic cost-per-cup promise.
References / Sources
-
U.S. Energy Information Administration, Electric Power Monthly: Average Retail Electricity Prices, May 2026.
-
Eurostat, Non-Household Electricity Prices in the Second Half of 2025, published May 8, 2026.
-
U.S. Bureau of Labor Statistics, National Employment and Wage Data by Occupation, May 2025, published May 15, 2026.
-
Eurostat, EU Hourly Labour Costs in 2025, published March 31, 2026.
-
U.S. Food and Drug Administration, Food Code 2022 and 2024 Supplement.
-
FoodServiceDirect, public soft serve mix pricing viewed July 2026.
-
WebstaurantStore, Frostline serving-yield information and public cup pricing viewed July 2026.

PREVIOUS ARTICLE
Ice Cream Vending Machine Shipping Cost and Total Import Expenses: What Overseas Buyers Should Know
NEXT ARTICLE