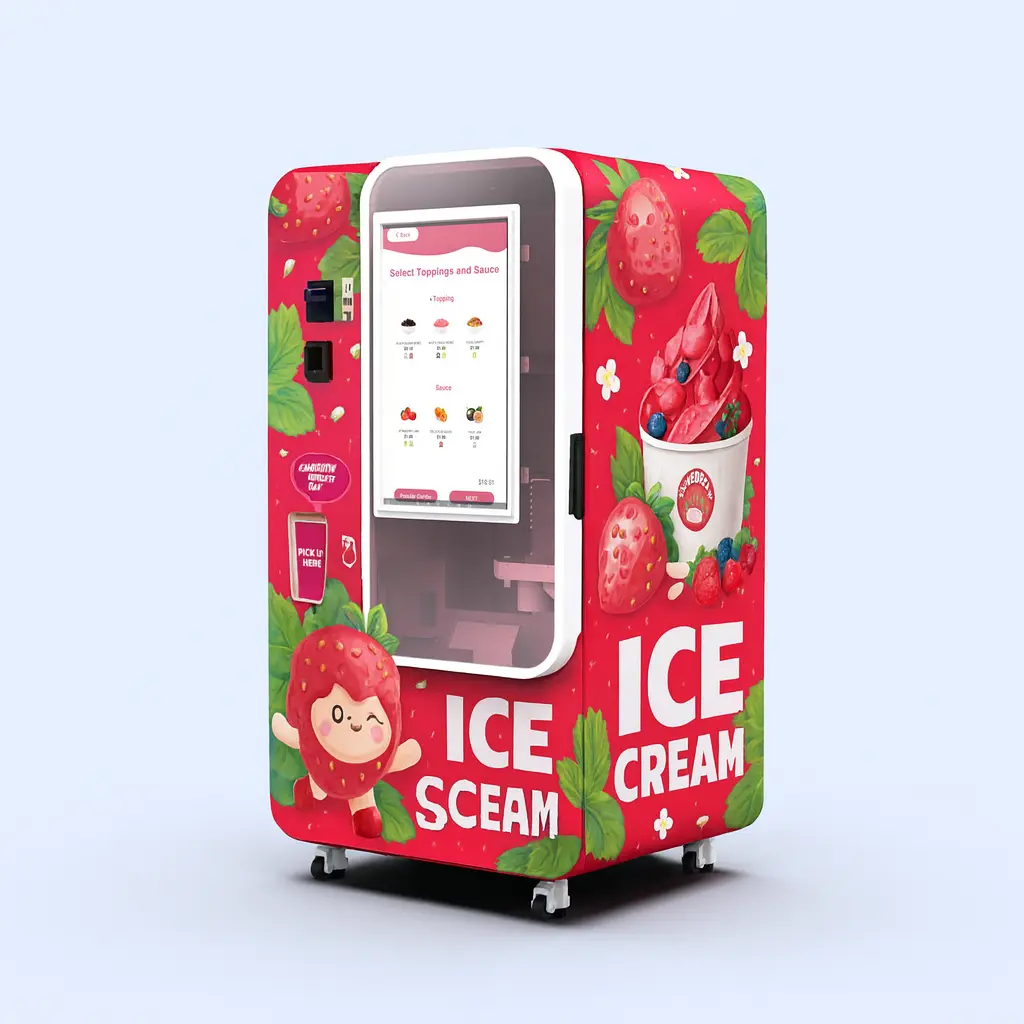
How Profitable Is an Ice Cream Vending Machine? Sales & Payback Guide
How profitable is an ice cream vending machine? Learn how to estimate daily sales, revenue, break-even volume and payback using realistic mall, campus, FEC, hotel and tourist-site scenarios.

How Profitable Is an Ice Cream Vending Machine?
Ask ten suppliers how profitable is an ice cream vending machine, and you may receive ten very different answers.
The reason is simple: the machine does not determine daily sales by itself.
A technically capable machine placed in a weak location can produce poor results. The same machine placed where the product fits the audience, the price is appropriate, payment is convenient and customer traffic is strong can perform very differently.
For an investor or operator, profitability therefore begins with five variables:
- Relevant customer traffic
- Purchase conversion
- Average selling price
- Cost per serving
- Fixed operating costs
The machine’s production capacity matters because it determines whether the equipment can support expected demand. But capacity should never be confused with demand.
A Huaxin full-size machine may complete a serving in approximately 15–20 seconds depending on recipe and operating conditions. That does not mean the machine will sell hundreds of cups every hour. Customers still need to notice the machine, decide to buy, complete payment and collect the product.
A realistic profitability study should therefore start from the location and work backward toward the machine—not start with the machine’s theoretical capacity and turn it into a revenue forecast.
There Is No Reliable Global “Cups Per Day” Benchmark
One of the most common questions from new operators is:
“How many cups can one ice cream vending machine sell per day?”
There is no single responsible answer.
A machine inside a hotel lobby has a different customer pool from one inside a family entertainment center. A campus behaves differently during examinations and holidays. A tourist location may be extremely busy for four months and quiet during the rest of the year.
Even two machines inside different parts of the same mall may perform differently because of:
- Visibility
- Nearby food competitors
- Customer direction of travel
- Dwell time
- Seating
- Distance from entrances
- Floor level
- Events
- Temperature
- Operating hours
This is why claims such as “a mall machine normally sells 100 cups per day” should be treated as assumptions unless supported by actual data from the specific property.
A better forecast starts with:
Expected daily cups = Relevant daily traffic × Estimated purchase conversion
“Relevant traffic” does not mean every person entering the building.
It means people who realistically pass the machine, can see it, can access it and have a reasonable opportunity to purchase.
Step 1: Estimate Relevant Traffic
Suppose a shopping mall reports 20,000 visitors per day.
That does not mean 20,000 people walk past the proposed machine.
If the machine is located in one corridor and approximately 12% of visitors pass that area:
20,000 × 12% = 2,400 relevant passersby
That 2,400 is a more useful starting point.
The operator then needs to estimate conversion.
If a hypothetical conversion assumption is 2%:
2,400 × 2% = 48 cups per day
If conversion falls to 1%:
24 cups per day
If it reaches 3%:
72 cups per day
That difference can completely change the financial result.
The lesson is not that 2% is the “correct” conversion rate. It is that a small change in conversion can have a large financial effect, so the assumption should be tested rather than hidden inside a spreadsheet.
Step 2: Build Three Sales Scenarios
A serious site evaluation should never use one daily-sales number.
Use at least:
- Conservative case
- Base case
- Strong case
For example:
Conservative: 25 cups/day
Base: 45 cups/day
Strong: 70 cups/day
These numbers are illustrative, not industry benchmarks.
The value of scenario analysis is that it shows whether the project only works under an optimistic assumption.
If a machine needs 70 cups per day just to cover operating expenses, while the conservative site model suggests 25–35 cups, the operator should investigate the location before ordering multiple machines.
How Different Locations Should Be Forecast
Different location types require different forecasting logic.
Shopping Mall
Mall demand is usually driven by:
- Relevant corridor traffic
- Weekend traffic
- Families and young consumers
- Food-court proximity
- Visibility
- Dwell time
- Competing desserts
- Site rent or revenue share
Do not rely only on total mall traffic.
Ask the property manager for traffic around the exact proposed position where possible.
A location beside entertainment, children’s activities or food traffic may behave differently from a quiet corridor near service businesses.
Family Entertainment Center
FECs can be particularly interesting because the product naturally fits:
- Families
- Children
- Birthday events
- Weekend visits
- Longer dwell time
- Impulse dessert purchases
The challenge is that sales can be concentrated.
A machine might have strong Saturday demand and much lower Tuesday demand.
For an FEC, operators should collect:
- Weekday visitor count
- Weekend visitor count
- Birthday/event volume
- Average customer dwell time
- Existing food and dessert options
Capacity and refill planning matter more when demand arrives in short peaks.
University or School Campus
A campus may offer a large repeat audience, but annualizing one strong school week can create a misleading forecast.
Important variables include:
- Class days
- Weekends
- Academic holidays
- Examination periods
- Summer break
- Student purchasing power
- Campus payment options
- Dormitory versus classroom location
The financial model should ideally use separate academic and holiday months.
Tourist Attraction
Tourist locations can produce some of the largest seasonal swings.
Factors include:
- Monthly visitor counts
- Weather
- Holiday calendars
- Tour-group schedules
- Local versus international visitors
- Payment compatibility
- Opening season
Research on retail forecasting consistently treats seasonality as an important demand feature, and ice cream is commonly used as an example of a category where summer periods and long vacations can affect demand.
For a tourist site, do not multiply August sales by twelve.
Build the year month by month.
Hotel
Hotels normally have a smaller customer population than major malls or tourist attractions, but they can offer other advantages:
- Long operating hours
- Convenient access
- Less direct dessert competition
- Lower or different site-fee structures
- Predictable guest flow
Useful data include:
- Occupancy
- Number of rooms
- Family versus business guest mix
- Restaurant operating hours
- Lobby traffic
- Pool or recreation access
The hotel model may work at lower volume if the fixed location cost is also low.
Illustrative Site Sales Model
The following examples are hypothetical planning scenarios only. They are not Huaxin customer results and should not be interpreted as average sales for each location type.
| Location | Relevant Daily Traffic Assumption | Hypothetical Conversion | Illustrative Daily Cups | Illustrative Selling Price | Monthly Revenue* |
|---|---|---|---|---|---|
| Shopping mall | 1,800 | 2.5% | 45 | USD 4.50 | USD 6,075 |
| Campus | 1,500 | 2.3% | ~35 | USD 4.25 | USD 4,463 |
| FEC | 1,000 | 6.0% | 60 | USD 4.75 | USD 8,550 |
| Tourist attraction | 1,200 | 4.2% | ~50 | USD 5.00 | USD 7,500 |
| Hotel | 250 | 7.0% | ~18 | USD 5.25 | USD 2,835 |
*Calculated using 30 operating days for comparison. Actual campuses, seasonal attractions and other locations may operate fewer effective sales days.
The table demonstrates why raw traffic cannot be used by itself.
The hypothetical FEC has lower total relevant traffic than the mall but a higher assumed conversion because the product may fit the audience and customer behavior more naturally.
The hotel has a relatively high conversion assumption but far fewer potential buyers.
These are forecasting mechanics—not market benchmarks.
What Selling Price Should You Use?
There is no global standard selling price for soft serve.
Price depends on:
- Country
- City
- Portion size
- Ingredients
- Toppings
- Location
- Competitors
- Brand positioning
For example, Dairy Queen Canada currently positions its small vanilla cone in an “Everyday Value Under $4” offer at participating Canadian locations. That is useful as a real market reference, but it should not be converted into a worldwide vending price assumption.
Before choosing a vending price, survey at least several nearby alternatives:
- Ice cream shops
- Soft serve kiosks
- Frozen yogurt stores
- FEC concessions
- Cafés
- Convenience stores
- Cinema dessert counters
Record:
- Product
- Portion
- Price
- Toppings
- Brand positioning
Then decide where the vending product should sit.
A lower selling price is not automatically better. It may increase conversion while reducing contribution per transaction.
Revenue Is Not Profit
After estimating daily sales and selling price:
Monthly revenue = Daily cups × Operating days × Average selling price
But revenue tells you very little about profitability until costs are removed.
At minimum, deduct:
Variable Costs
- Base mix
- Cup
- Spoon
- Toppings
- Product waste
- Payment processing
Fixed or Semi-Fixed Costs
- Site rent
- Revenue share
- Refill labor
- Cleaning
- Travel
- Electricity
- Connectivity
- Maintenance reserve
For more detailed cost calculation, these should be modeled separately rather than compressed into one arbitrary percentage.
Ingredient Cost Can Be Tested With Real Supplier Data
Public U.S. foodservice prices provide one way to test whether a model is reasonable.
As of August 2026, WebstaurantStore lists a case of Frostline vanilla soft serve mix at USD 86.99 for purchases of one to two cases. The listing states that each case contains six bags and produces approximately 15 gallons of prepared soft serve.
A 6 oz disposable frozen-yogurt cup is listed at USD 76.49 per 1,000, or about USD 0.076 before freight and other packaging costs.
These are U.S. public purchasing references only.
They do not include:
- Local delivery
- Spoon
- Toppings
- Waste
- Water or milk where applicable
- Import cost outside the U.S.
- Different recipes
- Different portion sizes
Operators should replace them with their own supplier quotations.
Calculate Contribution Per Cup
Suppose a hypothetical cup sells for USD 4.50.
Assume:
- Mix and recipe inputs: USD 0.55
- Cup and spoon: USD 0.12
- Toppings: USD 0.25
- Waste allowance: USD 0.08
- Payment fee: USD 0.15
Total variable cost:
USD 1.15
Contribution per cup:
USD 4.50 − USD 1.15 = USD 3.35
That USD 3.35 is available to cover fixed expenses.
It is still not net profit.
Calculate the Break-Even Daily Sales
Suppose fixed and semi-fixed monthly costs are:
- Site cost: USD 1,200
- Labor and service travel: USD 500
- Electricity and connectivity: USD 150
- Maintenance reserve: USD 150
Total:
USD 2,000 per month
Using the USD 3.35 contribution:
Monthly break-even cups = USD 2,000 ÷ USD 3.35 ≈ 597 cups
For 30 operating days:
Daily break-even ≈ 20 cups
The project begins producing an operating contribution above approximately 20 cups per day under this hypothetical model.
Change rent to USD 3,000 and the answer changes dramatically.
Change selling price from USD 4.50 to USD 3.50 and it changes again.
This is why “How many cups per day do I need?” is a much better question than “How much profit does the machine make?”
Daily Sales Sensitivity Can Change Payback Dramatically
Consider another illustrative model:
- Selling price: USD 4.50
- Variable cost per cup: USD 1.60
- Fixed monthly expenses: USD 2,100
- Total initial project capital: USD 30,000
- 30 operating days
Again, these figures are hypothetical and are not a Huaxin price or customer project.
| Scenario | Daily Cups | Monthly Revenue | Monthly Variable Cost | Fixed Cost | Operating Contribution | Simple Payback |
| Conservative | 30 | USD 4,050 | USD 1,440 | USD 2,100 | USD 510 | ~58.8 months |
| Base | 50 | USD 6,750 | USD 2,400 | USD 2,100 | USD 2,250 | ~13.3 months |
| Strong | 70 | USD 9,450 | USD 3,360 | USD 2,100 | USD 3,990 | ~7.5 months |
Nothing about the machine changed.
The difference came from daily sales.
This illustrates both the opportunity and the danger of ROI spreadsheets. A person who wants an attractive answer can simply increase the daily-sales assumption.
A responsible buyer should do the opposite: test what happens when sales are lower than expected.
Seasonal Demand Can Distort a Payback Calculation
Ice cream demand is not always evenly distributed through the year.
Seasonality can be influenced by:
- Temperature
- Rain
- School calendars
- Public holidays
- Tourism
- Events
- Indoor versus outdoor location
- Local dessert habits
Academic work on forecasting uses ice cream demand as a common example of seasonal time-series behavior, including higher demand during summer or long-vacation periods.
That does not mean every ice cream vending machine will be highly seasonal.
An indoor FEC in a hot climate may have relatively stable demand. An outdoor tourist location in a colder region may experience extreme variation.
The correct solution is monthly forecasting.
Example
Instead of:
60 cups/day × 365 days
Use:
- January: 25/day
- February: 28/day
- March: 35/day
- April: 45/day
- May: 60/day
- June: 75/day
- July: 85/day
- August: 80/day
- September: 55/day
- October: 40/day
- November: 30/day
- December: 35/day
These figures are purely illustrative.
What matters is the method: use different assumptions where demand is known to change.
High Traffic Does Not Automatically Mean High Profit
A high-traffic mall may look attractive but come with:
- Higher rent
- Revenue share
- Strict operating requirements
- Higher payment expectations
- More frequent service
A lower-volume hotel may have:
- Lower fixed cost
- Lower service frequency
- Lower competition
- Longer customer access hours
The better location is the one with stronger contribution after location-specific costs, not necessarily the one with more cups.
When comparing sites, calculate:
Site contribution = Revenue − Variable costs − Direct site operating costs
This allows two locations to be compared on the same basis.
Machine Capacity Should Match the Sales Forecast
Capacity matters once the location forecast begins to look credible.
A typical Huaxin full-size configuration can hold approximately:
- 160 cups
- About 20 L of base mix
Serving time is typically around 15–20 seconds depending on recipe and operating conditions.
These numbers help answer operational questions.
If the site may sell 120 cups during a strong day, the operator needs a very different refill schedule from a hotel forecast at 15–20 cups.
Capacity influences:
- Refill frequency
- Labor
- Peak-hour availability
- Waste risk
- Service-route planning
A larger capacity is not automatically better.
In a low-volume location, loading too much perishable product can increase waste.
Uptime Matters More Than Theoretical Capacity
A machine cannot generate revenue while unavailable.
Potential causes of lost operating time include:
- Ingredient shortage
- Cup shortage
- Payment failure
- Cleaning
- Network issues
- Component faults
- Delayed service response
Remote management can help operators identify machine status, sales activity, ingredient alerts and faults without making unnecessary inspection visits.
Automated cleaning and pasteurization functions can also support a more standardized maintenance process.
Neither feature eliminates physical service work.
Their commercial value is mainly in helping the operator protect availability and organize service more efficiently.
Practical Ways to Improve Daily Sales
Profitability improvements should focus on controllable variables.
Improve Visibility Before Discounting Price
Before lowering the selling price, check:
- Can customers clearly see the machine?
- Do they understand what it sells?
- Is the screen facing traffic?
- Is the machine hidden behind another kiosk?
- Can customers see the finished product?
A poor location cannot always be fixed with a cheaper product.
Simplify the Buying Process
Payment friction reduces conversion.
The required payment method depends on the market, but customers should be able to complete the transaction using familiar local methods.
Match the Menu to the Audience
An FEC, gym, tourist attraction and university do not necessarily need the same menu.
Product type, toppings and pricing should match the audience.
Avoid Empty-Machine Time
A machine that runs out of cups at 3 p.m. on Saturday has lost the most valuable hours of the week.
Remote alerts and service planning can help reduce this risk.
Track Sales by Hour and Day
Do not only look at monthly revenue.
Monitor:
- Cups by hour
- Cups by weekday
- Weekend versus weekday
- Weather
- Events
- Promotions
- School or holiday periods
This makes refill planning and site evaluation more objective.
Move Weak Machines When the Evidence Is Clear
Not every site will work.
Multi-location operators should compare locations and consider relocation when a machine consistently fails to reach the required break-even level.
Keeping a machine in a poor site because money has already been spent is not a profitability strategy.
Daily Sales and Revenue Planning Template
Country:
City:
Location Type:
Proposed Machine Position:
Total Site Visitors per Day:
Estimated Percentage Passing Machine:
Relevant Daily Traffic:
Conservative Conversion Assumption:
Base Conversion Assumption:
Strong Conversion Assumption:
Conservative Daily Cups:
Base Daily Cups:
Strong Daily Cups:
Average Selling Price:
Operating Days per Month:
Variable Cost per Cup:
Monthly Site Cost:
Monthly Service Labor:
Monthly Electricity / Connectivity:
Monthly Maintenance Reserve:
Conservative Monthly Revenue:
Base Monthly Revenue:
Strong Monthly Revenue:
Monthly Break-Even Cups:
Daily Break-Even Cups:
Initial Project Investment:
Illustrative Payback — Conservative:
Illustrative Payback — Base:
Illustrative Payback — Strong:
Seasonal Months Requiring Separate Forecast:
Every value should be replaced with project-specific information.
Location Profitability Checklist
Before approving a site, confirm:
- You know the approximate traffic around the actual machine position.
- You are not using total building visitors as machine traffic.
- You have conservative, base and strong conversion assumptions.
- Local competing dessert prices have been checked.
- Ingredient and packaging costs use the intended portion size.
- Payment fees are included.
- Rent or revenue share is confirmed.
- Refill and cleaning labor includes travel time.
- Seasonality has been considered.
- Weekday and weekend demand have been separated where relevant.
- The machine has enough capacity for the projected peak period.
- The refill plan can prevent cup or ingredient stockouts.
- Maintenance and downtime have been considered.
- Break-even daily sales have been calculated.
- The project still looks acceptable under the conservative case.
If the project only works under the strongest scenario, the buyer should gather more location data before committing to a large rollout.
FAQ
How many cups can an ice cream vending machine sell per day?
There is no reliable universal average. Daily sales depend on the location, relevant traffic, conversion rate, price, season, visibility, product and competition. Estimate daily sales from the specific site rather than using an industry-wide number.
How profitable is an ice cream vending machine?
Profitability depends on daily sales, selling price, cost per cup and fixed expenses such as rent and service labor. Revenue alone does not indicate profit.
How long does an ice cream vending machine usually take to pay back?
There is no responsible fixed payback period. Calculate it from total project investment divided by actual or carefully estimated operating contribution. Conservative, base and strong scenarios should all be tested.
Does a shopping mall always sell more than a hotel?
Not necessarily. A mall may have more traffic but also more competition and much higher site costs. A hotel may have lower volume but favorable rent and longer operating access. Evaluate the specific site economics.
How much does seasonality affect daily sales?
The effect depends strongly on the market and location. Outdoor and tourist sites may experience substantial seasonal variation, while indoor entertainment locations in warm climates may be more stable. Model sales month by month where seasonality is material.
Does faster machine production mean higher daily sales?
Not directly. Production speed determines capacity. Customer traffic and conversion determine sales. Faster production is valuable when expected peak demand would otherwise create a queue or bottleneck.
What is the best way to increase profitability?
Focus on relevant traffic, visibility, payment convenience, product-market fit, portion control, site cost, uptime and efficient service routes before relying on price discounts.
What information should I provide before requesting a project recommendation?
Provide the country, location type, estimated relevant traffic, planned machine quantity, product type, expected daily sales, payment requirements and launch date. The more accurate the location information, the more useful the configuration and budget discussion will be.
Conclusion: Profitability Starts With Daily Sales Assumptions You Can Defend
The answer to how profitable is an ice cream vending machine is not a fixed daily revenue figure or guaranteed payback period.
The answer comes from the specific site.
Start with:
- Relevant customer traffic
- Conservative conversion assumptions
- Daily cup volume
- Local selling price
- Cost per serving
- Site expenses
- Service costs
- Seasonality
- Initial project investment
Then calculate break-even sales and test several scenarios.
A machine capable of producing a serving in 15–20 seconds gives the operator enough production capability for many commercial applications, but only real customer demand turns that capacity into revenue.
For a more project-specific discussion, provide your country, proposed location, estimated traffic or target daily sales, machine quantity, product type, payment requirements and planned launch date.
Those inputs make it possible to evaluate the right configuration and build a more defensible revenue model—without relying on inflated daily-sales claims or guaranteed ROI.
Sources
-
Springer Nature, Deep Learning for Time Series Forecasting: A Survey (2025). Discusses seasonality in forecasting and uses tourism and ice cream sales during summer and long vacations as an example.
-
Dairy Queen Canada, Vanilla Cone — Everyday Value. Small vanilla cone currently positioned as an “Under $4” offer at participating Canadian locations, illustrating why local market pricing should be researched rather than assumed globally.
-
WebstaurantStore, Frostline Vanilla Soft Serve Ice Cream Mix, 6 lb., 6/Case. Public U.S. price checked August 2026: USD 86.99 per case for 1–2 cases; six bags per case and approximately 15 gallons of prepared product per case.
-
WebstaurantStore, Choice 6 oz. White Paper Frozen Yogurt / Food Cup. Public U.S. price checked August 2026: USD 76.49 per 1,000 cups.
-
U.S. Bureau of Labor Statistics, Occupational Employment and Wages — May 2025, published May 2026. Food preparation and serving-related occupations had a national mean hourly wage of USD 17.86 and median hourly wage of USD 16.85.
-
U.S. Energy Information Administration, Electric Power Monthly — May 2026, released July 23, 2026. Commercial electricity prices vary by period and location, reinforcing the need to use the operator’s actual utility tariff in profitability calculations.

PREVIOUS ARTICLE
Ice Cream Vending Machine Profitability and ROI: Realistic Calculation Guide for Operators
NEXT ARTICLE