Soft Serve Ice Cream Vending vs. Frozen Yogurt: Which Has Better Margins?
Date:2025-12-13 Author:Huaxin
In cold food vending, soft serve ice cream has lower costs, simpler equipment, and quicker payback, suitable for high-footfall urban areas. Frozen yogurt, with health appeal, targets niche channels, offers stable profits but higher costs. Hybrid deployment can maximize profitability.

In the cold food vending sector, many investors have faced the same dilemma: between soft serve ice cream and frozen yogurt, which business model is more worthy of adoption? The former is a traditional dessert in European and American markets, while the latter has rapidly gained popularity among fitness enthusiasts and white-collar workers in Europe and America, thanks to its "low-fat, high-protein" health label.
Some investors value the high sales volume and low operational threshold of soft serve ice cream, while others are optimistic about the premium potential and scenario adaptability of frozen yogurt. In fact, the differences in their profit logic lie mainly in cost structure, regional consumption preferences, and compliance requirements. We can break down key dimensions such as raw materials, equipment, and pricing to determine which option—soft serve ice cream vending machines or frozen yogurt—better fits the intended deployment scenarios.
Analysis of Product Raw Materials and Cost Structure
The difference in raw material costs between soft serve ice cream and frozen yogurt directly determines the comprehensive cost per serving of the finished product.The core raw material for soft serve ice cream is soft serve mix powder. The wholesale price of basic 1kg packages ranges from approximately $3–$5, while premium flavored varieties can reach $6–$10 per kg. Based on standard mixing ratios, 1kg of mix powder can produce 80–100 standard cones. When factoring in packaging and utility costs, the comprehensive cost per serving is only $0.3–$0.6. It has low storage requirements, needing only room temperature and protection from light; once opened, it can be stored sealed for up to a week without spoilage, with a loss rate controllable at 2%–3%. Many North American merchants report that the local supply chain for soft serve ice cream raw materials is mature, with a lead time of just 1–2 days, making inventory management easy even for beginners.
Frozen yogurt raw material costs are significantly higher. Its base requires organic raw milk combined with active probiotics, and the procurement cost of organic strains alone is 20%–30% higher than that of regular ice cream powder, with the need for cold chain transportation throughout the process. The fermentation process also results in 5%–8% material loss, and products risk being removed from shelves if they fail to meet local FDA (Food and Drug Administration) standards for viable bacteria count. According to industry ratios, 1kg of organic yogurt base yields only 60–70 servings of finished product. Combined with biodegradable cups and basic oat toppings, the comprehensive cost per serving reaches $0.7–$1.1, roughly 50% higher than that of soft serve ice cream. Additionally, opened frozen yogurt raw materials must be refrigerated and used within 48 hours, leading to significant raw material waste, especially at low-footfall locations.
Equipment Requirements and Long-Term Operation & Maintenance
Equipment investment depends not only on the machine’s upfront price but also on local safety certifications, payment compatibility, and labor maintenance costs—core factors influencing initial investment and long-term operations.Soft serve ice cream machines have a simple structure, with refrigeration and mixing systems as their core components. Daily maintenance consists primarily of basic cleaning, with monthly maintenance costs around $20–$30, a repair response time of no more than 24 hours, and an overall extremely low failure rate.
Frozen yogurt vending machines have notably higher entry barriers. They require dual temperature control systems for "low-temperature fermentation + frozen forming" and stricter temperature regulation to maintain probiotic activity, with pipeline sealing standards that must comply with food contact material regulations. In terms of maintenance, frozen yogurt machines have more cumbersome cleaning procedures, with extremely rigorous requirements for cleaning frequency and thoroughness. Monthly maintenance costs amount to $40–$50, and repair cycles can last 3–5 days, directly disrupting business operations.
In terms of payback period, soft serve ice cream machines recoup their investment in 3–6 months, while frozen yogurt machines, due to equipment and compliance premiums, have an extended payback period of 8–12 months. In the long run, frozen yogurt machines carry slightly higher maintenance costs and potential downtime risks.
Market Pricing and Consumption Frequency
Product pricing and consumption frequency are heavily influenced by regional culture and customer demographics. The differences in pricing logic and repurchase habits between soft serve ice cream and frozen yogurt directly determine revenue performance.Soft serve ice cream is priced lower than frozen yogurt. In the North American market, regular cones sell for approximately $1.5–$3, while specialty sundaes can reach $4–$6, yielding a gross profit of $1.2–$5.4 per serving and a gross profit margin of around 75%–90%. Soft serve ice cream consumption is mostly impulsive and indulgent, commonly occurring in leisure settings such as shopping malls, cinemas, and scenic spots. Its repurchase rate relies on flavor innovation and consumption experience.
Frozen yogurt achieves premium pricing through its health attributes: basic cup servings are priced at $3–$5, and DIY organic fruit varieties can reach $7–$10, with a gross profit of $2.3–$8.9 per serving and a gross profit margin of 80%–92%. Its core customer base includes fitness enthusiasts and office white-collar workers, who make more rational purchasing decisions, leading to potentially more stable repurchase rates, though the overall audience reach is slightly narrower.
Regional Climate and Scenarios Determine Profit Stability
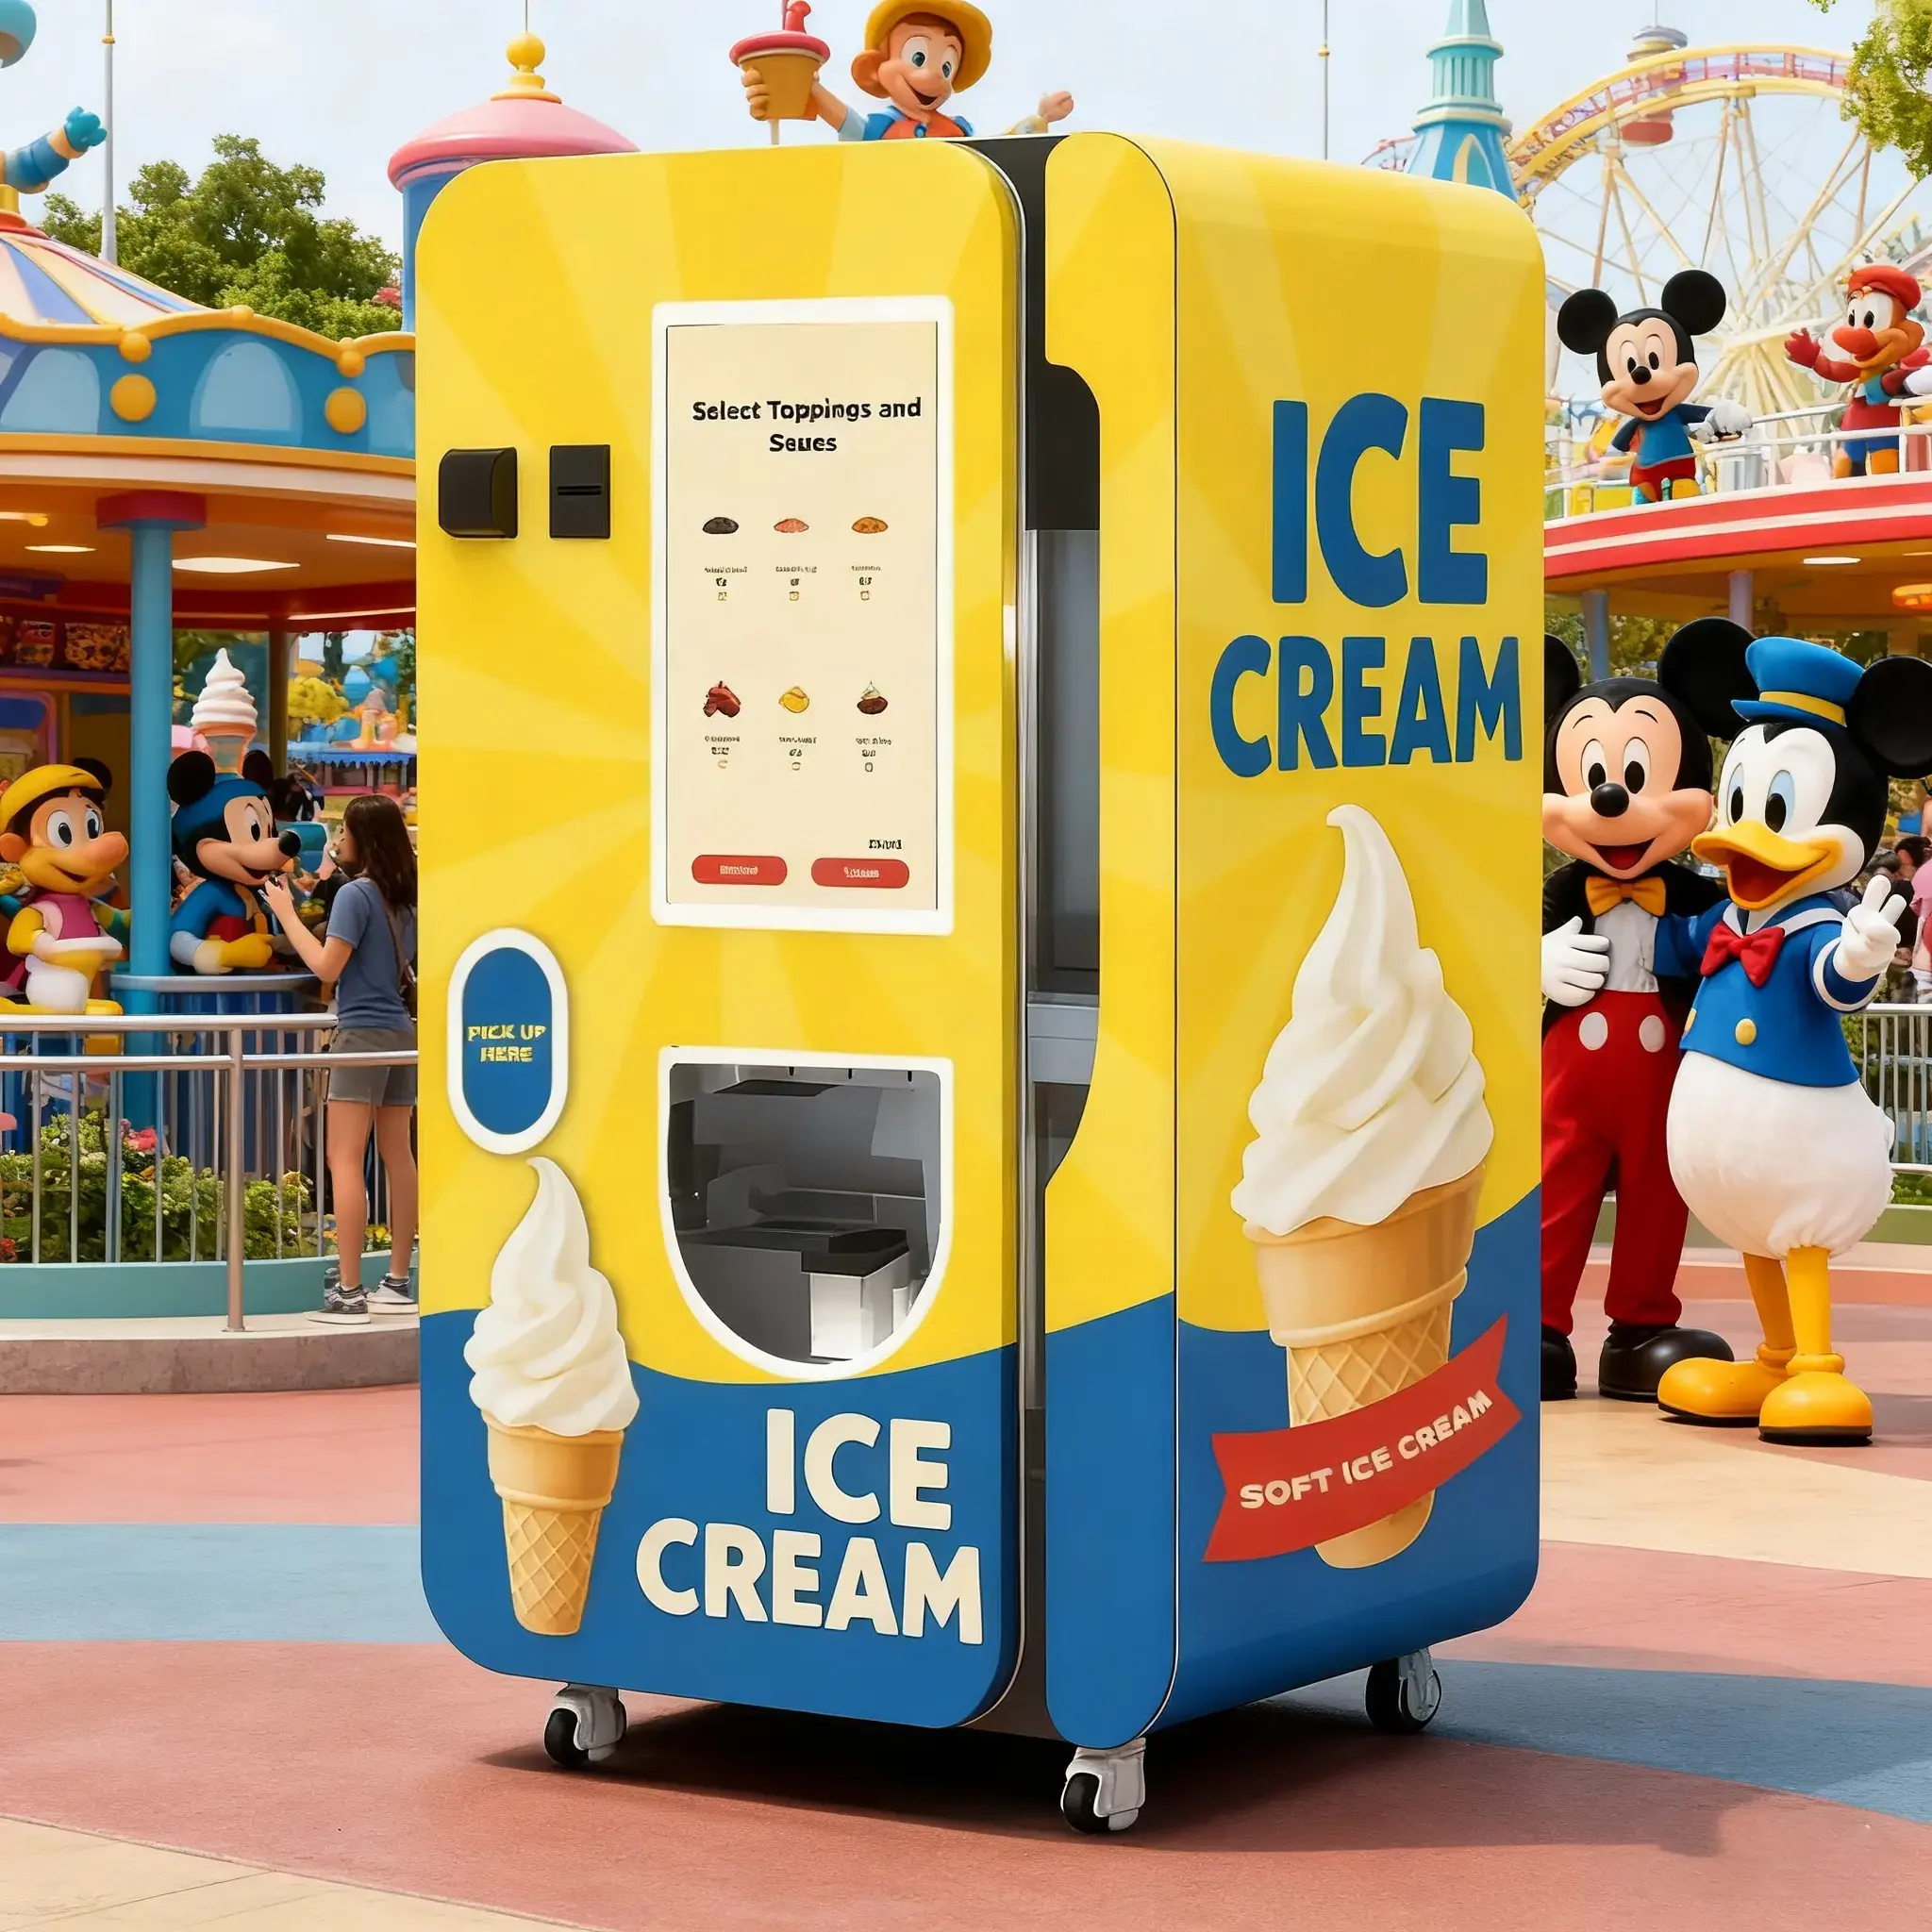
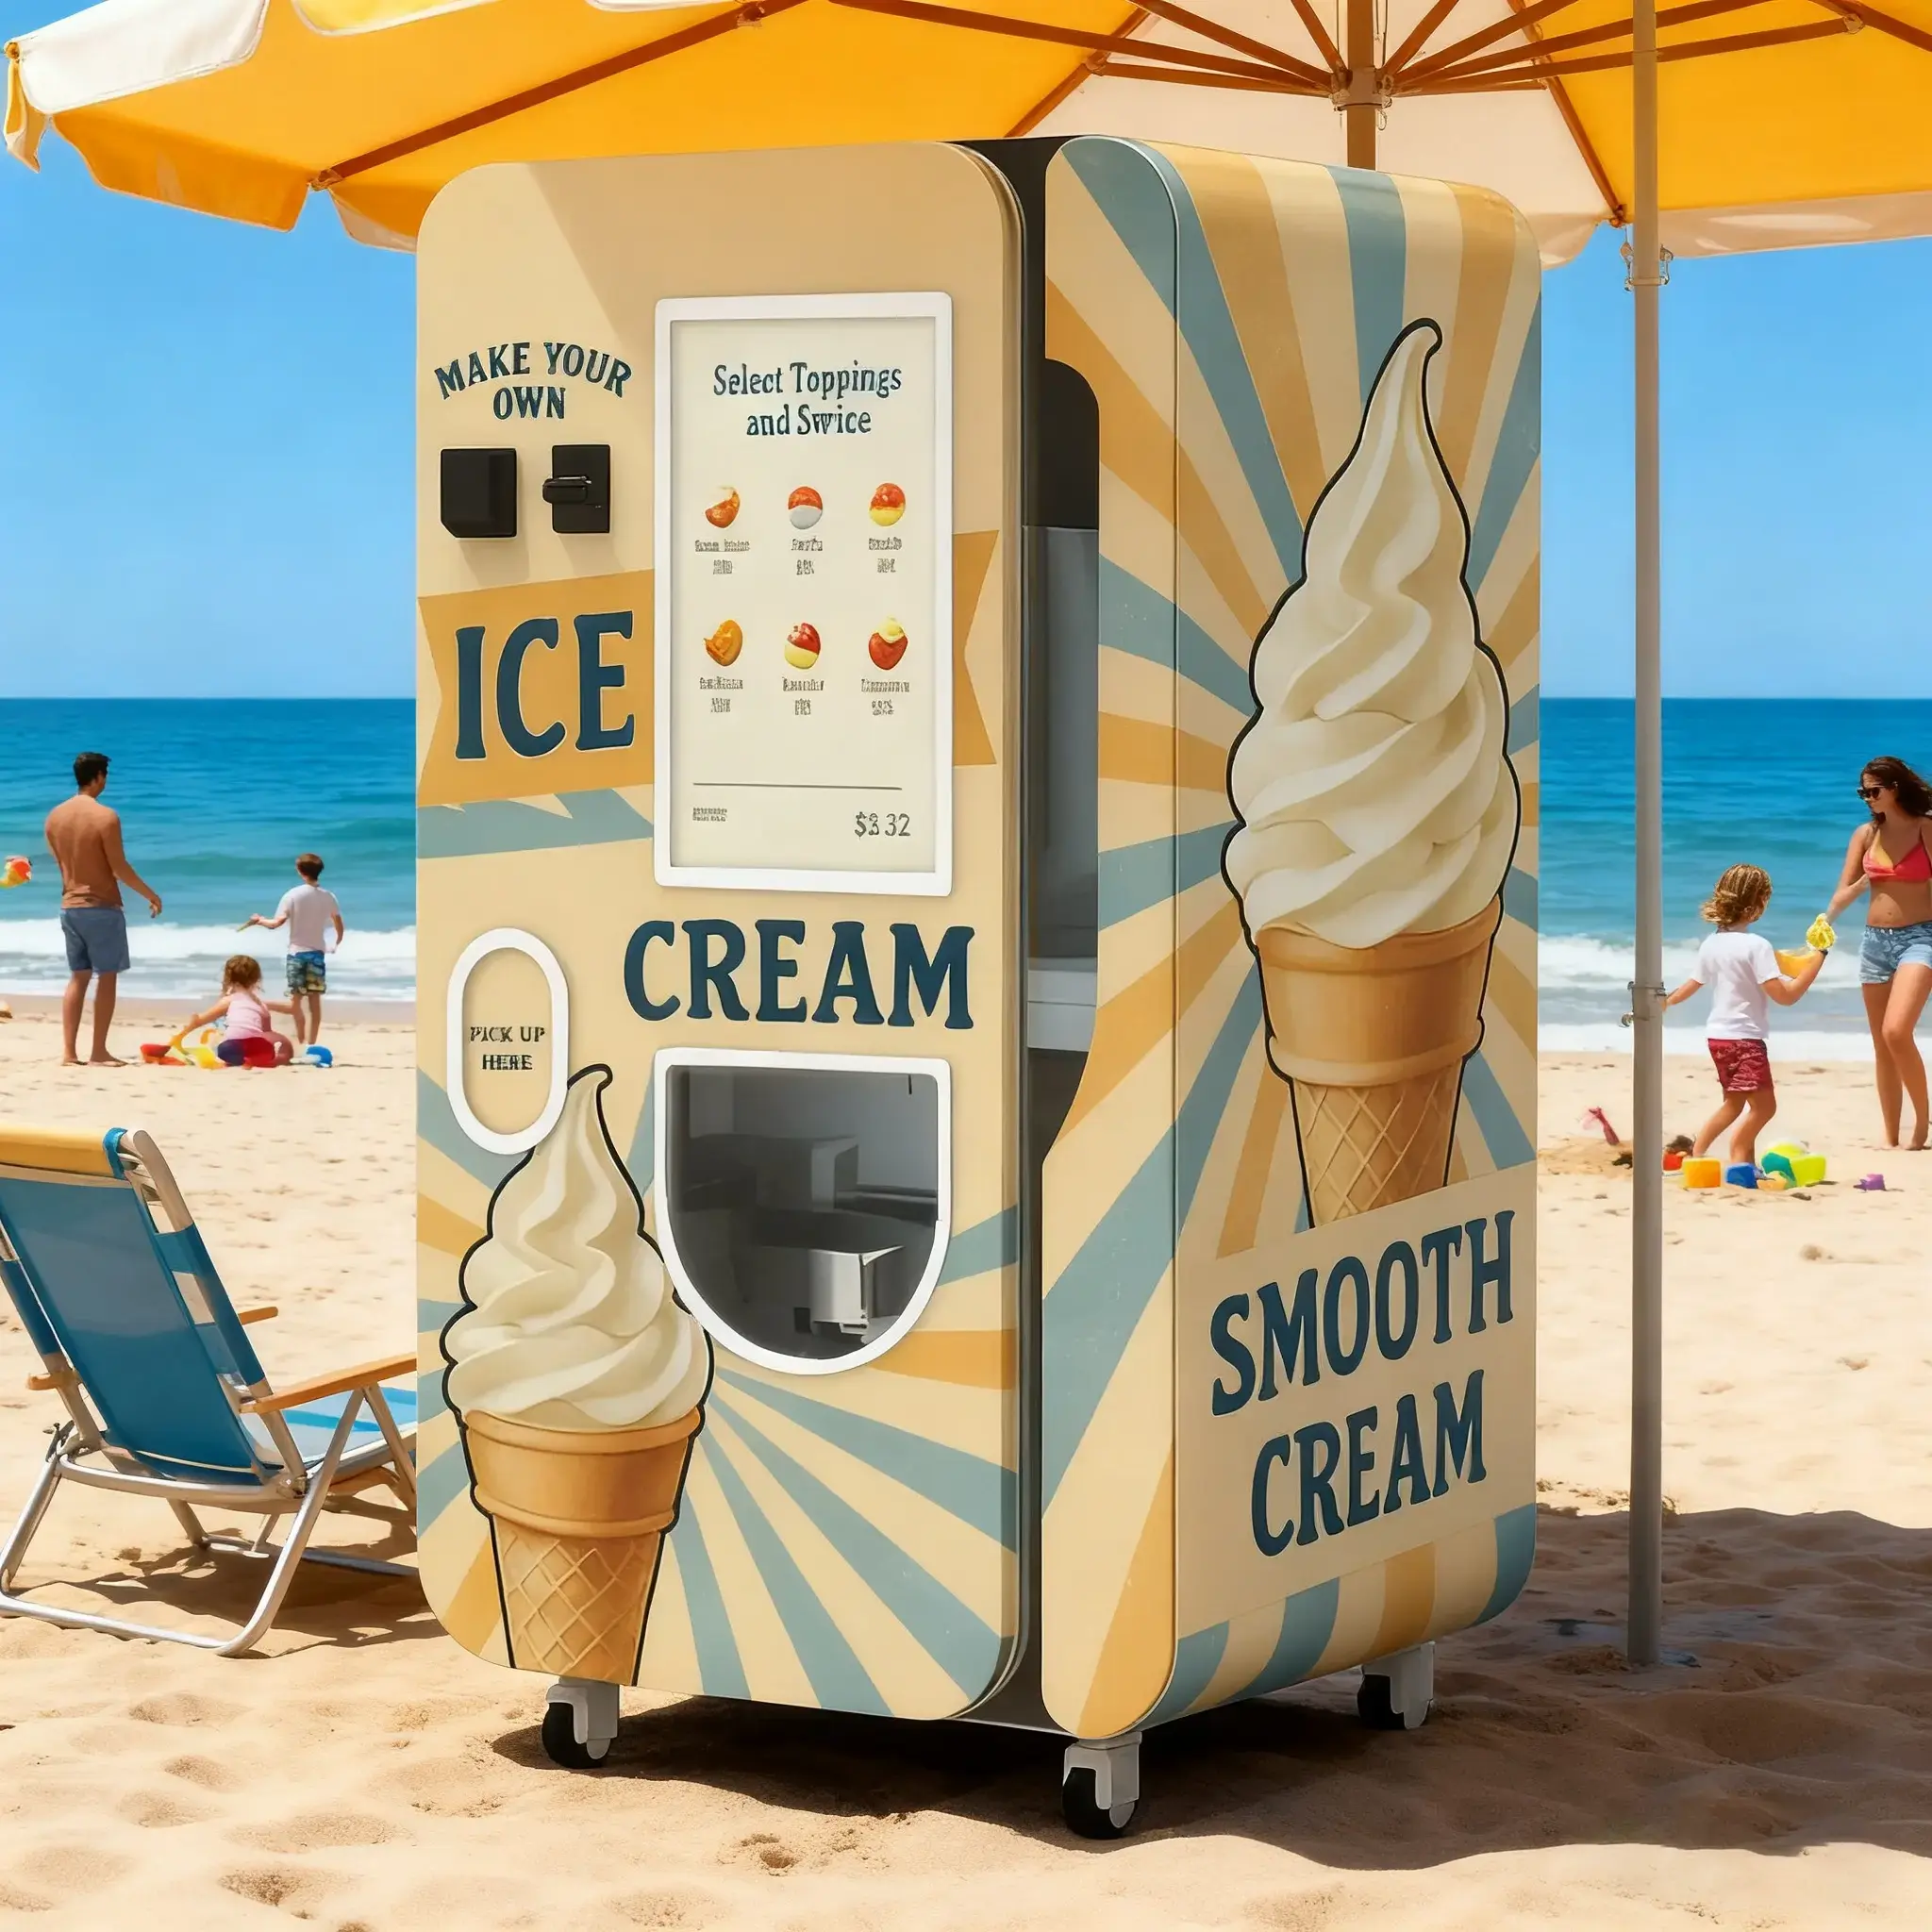
Product characteristics dictate their optimal deployment scenarios, which directly impact the balance of annual revenue.Soft serve ice cream has strong seasonality: 70% of revenue in the North American market is generated in summer, with weaker performance in spring, autumn, and winter; in the Mediterranean region of Europe, the peak season coincides with the tourist period from April to October. Its suitable scenarios are highly concentrated in high-footfall, seasonal locations such as theme parks, coastal promenades, and outdoor markets. These areas can quickly clear inventory during peak seasons, but equipment idle rates rise in off-seasons. Some merchants choose to shut down machines in winter to save electricity costs, while others launch seasonal marketing campaigns to boost sales.
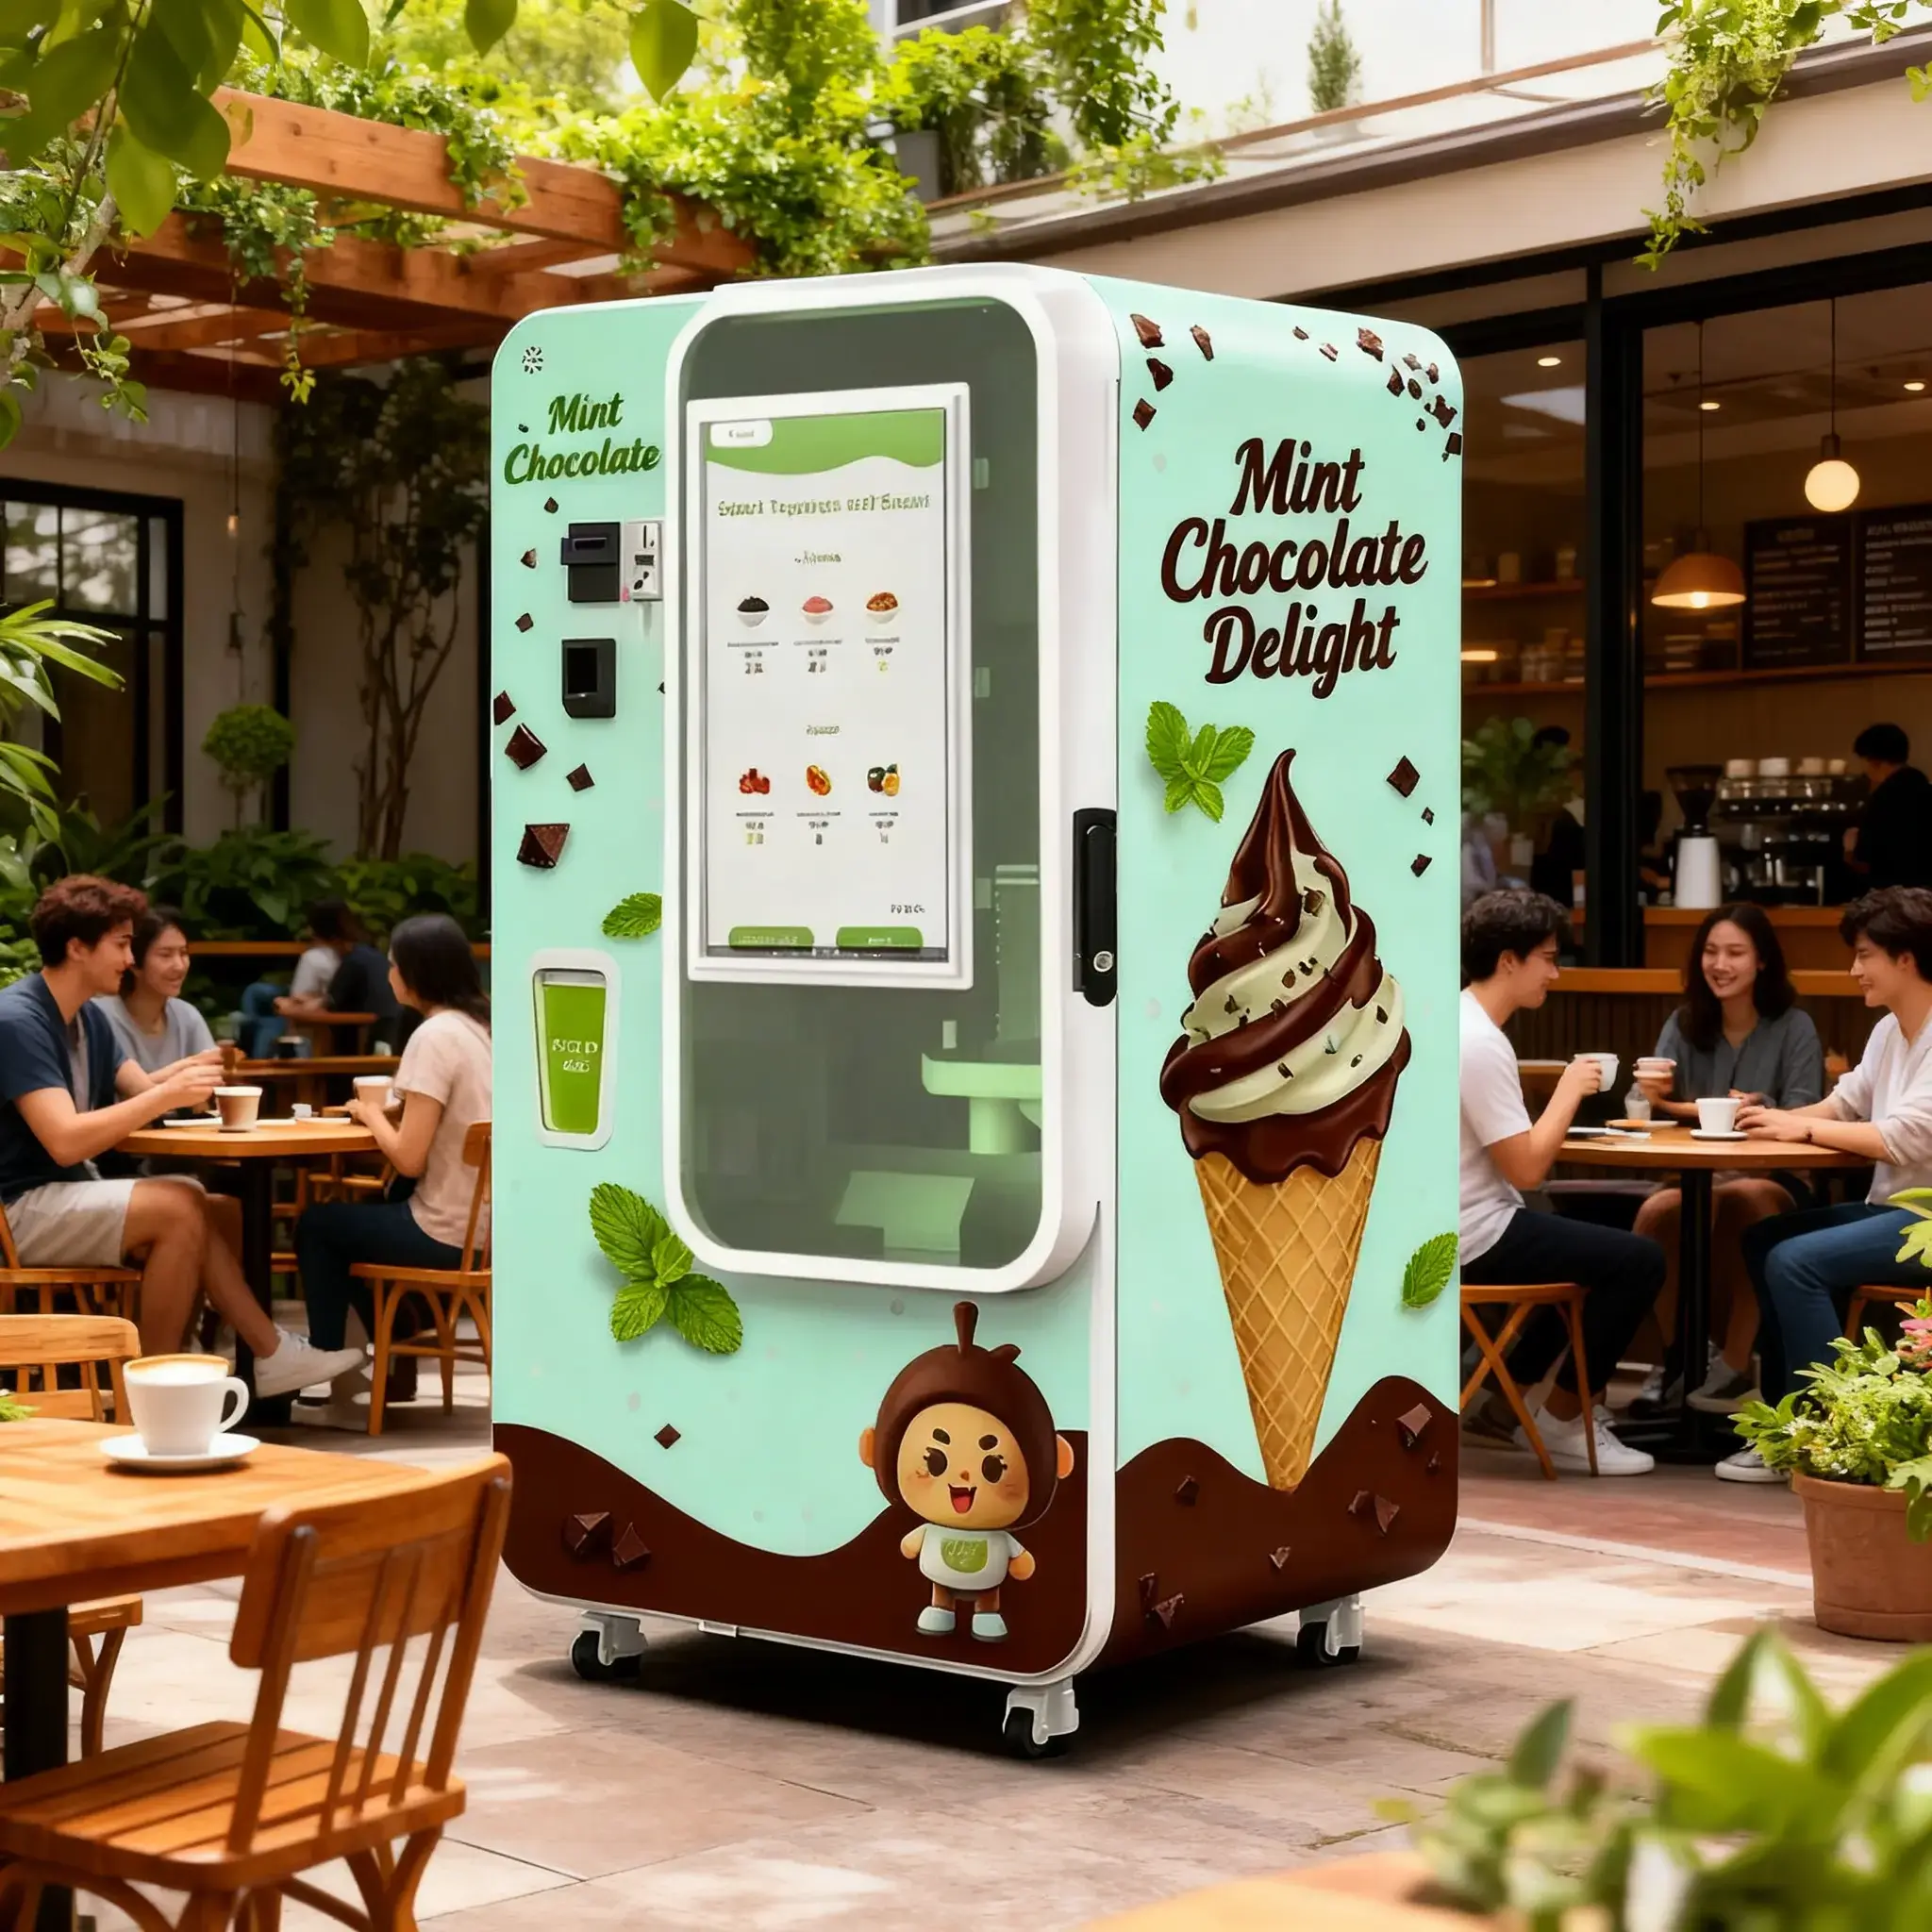
Frozen yogurt has less seasonal fluctuation than soft serve ice cream. On one hand, its "healthy and low-calorie" positioning weakens its role as a heat-relief treat; on the other hand, some merchants develop winter hot offerings (e.g., cinnamon hot yogurt, gingerbread-flavored frozen yogurt) to achieve year-round operations. It also has broader scenario adaptability, being deployable in North American fitness chains, European organic supermarkets, and Australian community convenience stores. However, it is worth noting that frozen yogurt underperforms in purely recreational settings. Merchants at Disneyland Paris have reported that frozen yogurt sales are only one-third of soft serve ice cream sales, as tourists prefer traditional desserts.
Some intelligent ice cream vending machines have undergone upgrades. For example, Huaxin Technology’s intelligent ice cream vending machines are adaptable to most indoor and outdoor scenarios, offering high flexibility with customizable functions based on season and location.
Profit Margin Comparison and Selection Recommendations
| Comparison Dimension | Soft Serve Ice Cream Vending | Frozen Yogurt Vending |
| Raw Material Cost per Serving | $0.3–$0.6 | $0.7–$1.1 |
| Initial Equipment Investment | $4,000–$6,000 | $5,000–$7,000 |
| Price per Serving | $1.5–$6 | $3–$12 |
| Gross Profit per Serving | $1.2–$5.4 | $2.3–$8.9 |
| Gross Profit Margin | 75%-90% | 80%-92% |
| Payback Period | 3–6 months | 8-12 months |
Prioritize soft serve ice cream for scale: If your strategy is to rapidly deploy machines across multiple high-footfall urban locations, pursuing maximum market coverage and cash flow, soft serve ice cream is the more reliable and versatile choice. Its controllable costs, broad audience, and relatively simple equipment operation and maintenance enable faster returns from premium locations, with payback achievable in 3–4 months.
Opt for frozen yogurt for differentiation: If you have access to or can tap into high-quality niche channels (e.g., chain gyms, upscale communities, health industrial parks), and your target customers have strong purchasing power, are price-insensitive, and value health labels, frozen yogurt can foster greater customer loyalty, delivering stable and substantial profits.
Hybrid deployment: For merchants with the means, investing in both types of machines allows prioritizing soft serve ice cream in peak seasons and relying on frozen yogurt and hot yogurt drinks to sustain revenue in off-seasons. Additionally, tailoring products to different customer segments maximizes overall profitability.
In the cold food vending market, soft serve ice cream and frozen yogurt are not mutually exclusive choices but rather require precise deployment based on regional market characteristics, location scenarios, and one’s own financial strength. For investors, only by analyzing local customer needs, controlling supply chain costs, and optimizing equipment operation and maintenance efficiency can long-term, stable profitability be achieved.