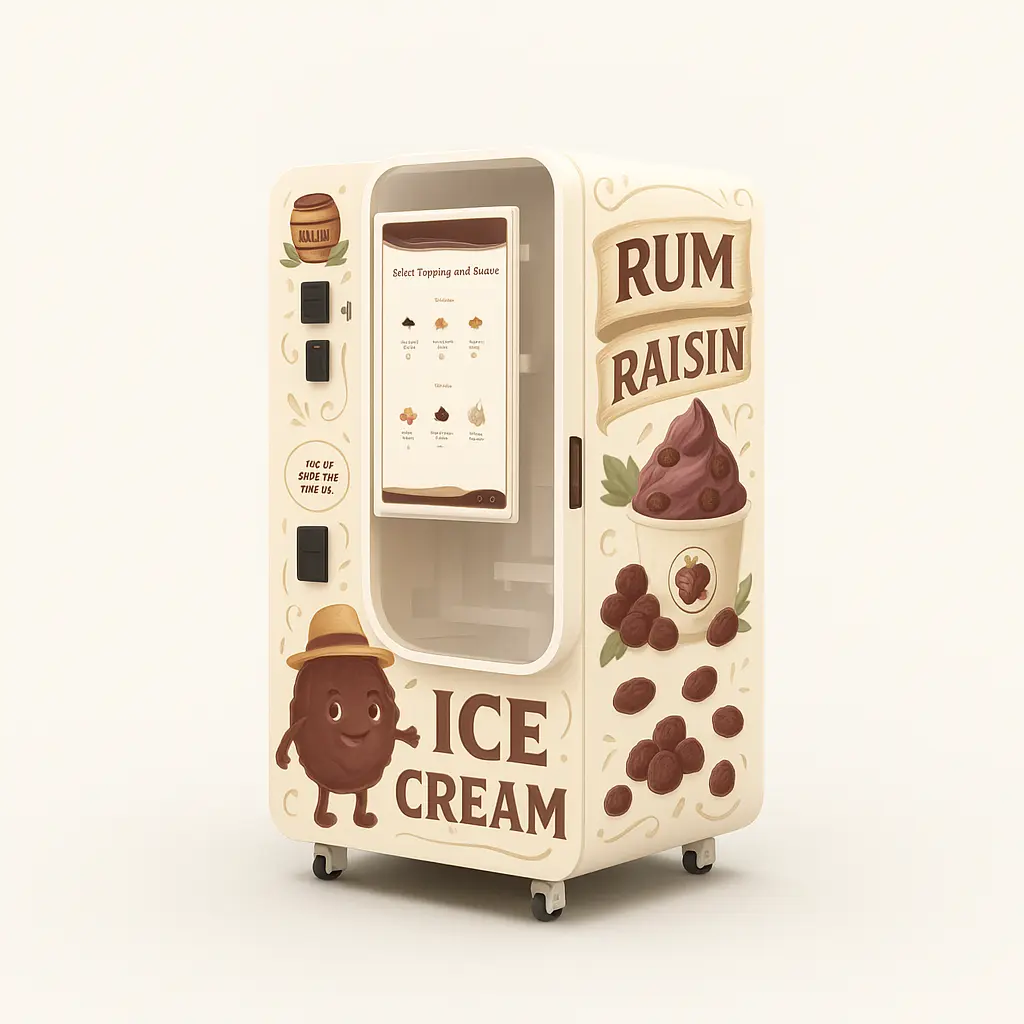
Ice Cream Vending Machine Cost Per Serving and Quote Guide: What Buyers Should Provide
Learn how to calculate ice cream vending machine cost per serving and what information buyers should provide to receive an accurate machine, shipping and operating quotation

The ice cream vending machine cost per serving cannot be calculated from the machine price alone. It depends on the recipe, portion size, paper cup, spoon, toppings, payment fees, electricity, refill labor, cleaning, site agreement, maintenance reserve and the number of servings sold during the calculation period.
This is also why a supplier cannot provide a commercially meaningful quotation after receiving only one question: “What is your best machine price?”
The supplier may be able to quote a base unit, but not the correct payment setup, shipping scope, capacity, destination cost or operating configuration. Two buyers purchasing the same machine can have very different project budgets because one is installing it in a high-traffic family entertainment center while the other is testing it in a small hotel lobby.
A useful evaluation therefore requires two separate calculations:
- The project quotation: what it costs to purchase, configure and deliver the machine.
- The cost per serving: what it costs to prepare and sell each cup after launch.
The first determines the capital required to start. The second determines whether the proposed menu, location and service plan are operationally realistic.
Start With Two Different Cost Models
Buyers frequently combine equipment investment and daily operating cost into one unclear figure. That makes quotations difficult to compare and can produce misleading profitability assumptions.
The project budget should be divided into two models.
Initial Project Cost
This may include:
- Purchase-ready machine
- Payment hardware
- Branding and interface customization
- Export packaging
- Shipping
- Insurance
- Import duty and tax
- Local delivery
- Installation preparation
- Starter spare parts
Recurring Cost Per Serving
This may include:
- Base mix
- Water, milk or other recipe input
- Paper cup
- Spoon or lid
- Toppings and sauces
- Product waste
- Payment transaction fee
- Allocated electricity
- Allocated refill and cleaning labor
- Allocated site fee
- Maintenance reserve
- Connectivity or software allocation
The machine price belongs mainly to the initial project model. It can also be allocated across servings as depreciation or capital recovery, but that calculation should be kept separate from the direct operating cost.
What Does “Cost Per Serving” Actually Mean?
There are three useful versions of cost per serving.
Direct Product Cost
This is the cost of physically producing and packaging one cup.
Direct product cost per serving = Base mix + preparation inputs + cup + spoon + toppings + expected waste
This figure is useful for recipe and menu decisions.
Operating Cost Per Serving
This adds costs that support daily operation.
Operating cost per serving = Direct product cost + payment fee + electricity allocation + labor allocation + site allocation + maintenance reserve
This figure is more useful for comparing locations and setting a realistic selling price.
Fully Loaded Cost Per Serving
This may also include:
- Machine depreciation
- Financing
- Insurance
- Business overhead
- Software management
- Accounting
- Local warehousing
- Management time
Fully loaded cost per serving = Operating cost per serving + Allocated capital and overhead costs
Buyers should specify which version they are discussing. A supplier may quote an ingredient cost per cup, while an operator is actually asking for a fully loaded commercial cost. Those are not the same number.
Complete Cost Per Serving Structure
| Cost Layer | Typical Items | Calculation Method |
|---|---|---|
| Base product | Soft serve, frozen yogurt, sorbet or açaí-style mix | Batch cost ÷ saleable servings |
| Packaging | Cup, spoon, lid and napkin | Purchase cost per unit |
| Toppings | Granola, nuts, dry fruit, sauce or jam | Pack cost ÷ controlled portions |
| Waste | Testing, overfilling, cleaning loss and spoilage | Actual monthly waste ÷ cups sold |
| Payment | Transaction percentage and fixed fee | Processor fee per transaction |
| Electricity | Refrigeration, screen, controls and production | Monthly electricity cost ÷ cups sold |
| Labor | Travel, refill, cleaning and inspection | Monthly service labor ÷ cups sold |
| Site | Rent, minimum guarantee or revenue share | Monthly site cost ÷ cups sold |
| Maintenance | Parts, service and emergency logistics | Monthly reserve ÷ cups sold |
| Connectivity | SIM, data, software or terminal rental | Monthly charge ÷ cups sold |
| Capital allocation | Machine and setup investment | Chosen depreciation basis ÷ cups sold |
The first four rows are usually linked closely to each sale. The remaining rows depend heavily on location volume and operating efficiency.
Step 1: Calculate the Base Mix Cost Correctly
The price of a bag or carton is not the cost per serving.
Start with the prepared batch:
Prepared batch cost = Mix purchase price + Water or milk + Inbound delivery + Other recipe inputs
Then determine actual saleable yield:
Base cost per serving = Prepared batch cost ÷ Saleable cups
The word “saleable” is important. Supplier yield may be based on a specific serving volume under controlled conditions. The operator’s real yield can be lower because of:
- Larger cup size
- Overfilling
- Recipe adjustment
- Testing
- Product retained in the system
- Cleaning loss
- Spillage
- Unsold product
- Inconsistent portion control
Public Price Reference
A public U.S. foodservice listing checked in July 2026 priced a case of Frostline vanilla soft serve mix at USD 86.99 for one to two cases, or USD 77.44 for three or more cases. The case contains six bags, and each bag is listed as yielding approximately 88 two-thirds-cup servings.
Using the regular case price:
- Listed servings per case: 6 × 88 = 528
- Nominal dry-mix cost: USD 86.99 ÷ 528
- Approximate listed mix cost: USD 0.16 per serving
This is not a complete vending cost. It excludes:
- Water or milk
- Delivery
- Waste
- Cup and spoon
- Toppings
- Electricity
- Payment processing
- Labor
- Site cost
It is also a U.S. public retail example, not a global ingredient benchmark or Huaxin customer result.
Step 2: Add Cups, Spoons and Toppings
A public U.S. listing checked in July 2026 priced 6 oz paper frozen-yogurt cups at USD 76.49 per 1,000, or approximately USD 0.08 per cup before delivery.
The same product range listed compatible disposable spoons at approximately USD 0.02–0.03 each, depending on type and quantity.
That means basic packaging could begin around:
- Cup: USD 0.08
- Spoon: USD 0.02–0.03
- Basic packaging subtotal: approximately USD 0.10–0.11
This figure can change with:
- Larger cup size
- Custom printing
- Lid
- Premium spoon
- Imported supply
- Minimum order quantity
- Local freight
- Cup rejection or feeding problems
Cup compatibility matters as much as price. A cheaper cup that bends, sticks or fails to feed consistently can increase refunds, waste and service visits.
Toppings Need Portion Control
Topping cost should be calculated from the average amount dispensed per order.
Topping cost per serving = Pack cost ÷ Number of controlled portions
Do not divide the topping purchase price by estimated sales without measuring actual usage.
For example, if a USD 24 topping carton produces 160 controlled portions:
USD 24 ÷ 160 = USD 0.15 per serving
If customers receive inconsistent portions, the real cost may be higher.
Soft serve, frozen yogurt, sorbet and açaí-style products can have different topping strategies. An açaí-style menu with granola, nuts and sauce may have a higher cost per serving than a simple vanilla soft serve menu.
Huaxin machines normally operate with one base product at a time. Changing from soft serve to frozen yogurt, sorbet or an açaí-style formulation requires changing the base material and adjusting the recipe.
Step 3: Account for Product Waste
Waste is one of the most commonly ignored costs in planning models.
Possible causes include:
- Recipe testing
- Cleaning cycles
- Product left in the system
- Incorrect portion settings
- Damaged cups
- Topping overuse
- Ingredient expiration
- Machine downtime
- Low demand after refilling
- Operator mistakes
The most useful waste formula is:
Waste cost per serving = Monthly ingredient and packaging loss ÷ Monthly cups sold
Assuming zero waste may make the spreadsheet look attractive, but it does not reflect real food-service operation.
For an initial illustrative model, a buyer can include a small waste allowance and replace it with actual data after launch.
Step 4: Allocate Electricity
The machine’s rated power is not the same as continuous electricity consumption. Refrigeration, the screen, lighting, control systems and production components operate at different loads.
The proper calculation is:
Electricity cost per serving = Measured monthly kWh × Local tariff ÷ Monthly cups sold
For context, the U.S. Energy Information Administration reported an average commercial electricity price of 13.79 cents per kWh for January through May 2026. Local utility tariffs can be materially higher or lower.
Consider two machines with the same monthly electricity bill of USD 75:
- Machine A sells 500 cups: USD 0.15 electricity per cup
- Machine B sells 2,000 cups: USD 0.04 electricity per cup
The machine has not become more energy-efficient. The fixed and semi-fixed electricity cost is simply distributed across more sales.
This is one reason cost per serving depends heavily on location volume.
Step 5: Allocate Refill, Cleaning and Service Labor
Automatic vending reduces continuous counter staffing, but someone still needs to:
- Refill mix
- Refill cups and toppings
- Clean food-contact and customer areas
- Remove waste
- Inspect the machine
- Respond to alerts
- Travel to the site
- Record inventory
- Handle occasional customer issues
Calculate the complete service visit:
Service visit cost = Travel time + On-site time + Vehicle cost + Parking or access cost
Then calculate:
Labor cost per serving = Monthly service cost ÷ Monthly cups sold
A U.S. Bureau of Labor Statistics industry table reports a 2025 median hourly wage of USD 14.80 for combined food preparation and serving workers in food-service businesses. The operator’s real employer cost may be higher after payroll taxes, insurance, management, scheduling and transport are included.
For overseas projects, local labor figures should always replace the U.S. reference.
Step 6: Add Payment, Connectivity and Site Costs
Payment Processing
Payment cost may include:
- Percentage transaction fee
- Fixed fee per transaction
- Terminal rental
- Gateway fee
- Settlement fee
- SIM or data fee
- Refund cost
A fixed fee has a larger effect on a low-value transaction. Buyers should therefore ask the local payment provider for the exact pricing model rather than using a generic global rate.
Site Cost
A location agreement may use:
- Fixed monthly rent
- Revenue share
- Minimum monthly guarantee
- Fixed rent plus revenue share
- Electricity surcharge
- Promotional or administration fee
The site cost per serving is:
Site cost per serving = Monthly site cost ÷ Monthly cups sold
A location with higher sales is not automatically better if its rent or revenue share is disproportionately high.
Remote Management
Remote management can help reduce unnecessary visits by showing machine status, sales data, temperature alerts and fault information.
It does not eliminate physical refilling or cleaning. Its financial value depends on:
- Number of machines
- Distance between locations
- Labor cost
- Frequency of unnecessary inspection visits
- Speed of fault response
- Connectivity charges
For a single nearby machine, the savings may be modest. For multiple machines across a city, remote management becomes more important.
Step 7: Build a Maintenance Reserve
Maintenance is not a predictable per-cup purchase, but it should still be represented in the model.
The reserve may cover:
- Seals
- Tubes
- Sensors
- Motors
- Pumps
- Payment hardware
- Refrigeration service
- Local technician visits
- International spare-parts shipping
- Emergency site visits
Maintenance cost per serving = Monthly maintenance reserve ÷ Monthly cups sold
The appropriate reserve depends on:
- Machine quantity
- Local technician availability
- Spare-parts lead time
- Site distance
- Operating hours
- Product type
- Financial impact of downtime
Automated cleaning or pasteurization functions can reduce repetitive manual steps and improve process consistency, but they do not remove the need for sanitation, inspection and component maintenance.
How Machine Configuration Affects Cost Per Serving
| Configuration | Possible Operating Benefit | Possible Cost Impact |
| Stable refrigeration | Better texture and temperature control | Electricity use and higher initial specification |
| Larger cup storage | Fewer refill visits | More stock held inside the machine |
| Larger mix capacity | Longer operation between refills | Greater waste exposure at a low-volume site |
| Automated cup handling | More consistent service flow | Additional moving components |
| Remote management | Fewer unnecessary visits and faster alerts | Network or software charges |
| Automated cleaning functions | More standardized cleaning process | Does not eliminate manual sanitation |
| Multi-payment support | Better customer accessibility | Hardware and transaction fees |
| Larger touchscreen | Stronger menu and brand presentation | Energy use and replacement cost |
Huaxin’s full-size automatic vending platform can typically produce a serving in approximately 15–20 seconds, depending on the recipe and operating conditions. Typical configurations may also support around 160 cups and approximately 20 liters of mix.
These figures help with capacity planning, but production speed should not be confused with actual hourly sales. Customer decision time, payment, pickup, demand pattern and topping selection also affect throughput.
Illustrative Cost Per Serving Model
The following calculation is hypothetical. It is not a Huaxin customer result, a profit forecast or a guaranteed operating cost.
Illustrative Assumptions
- 60 cups per day
- 30 operating days
- 1,800 monthly cups
- Soft serve base
- Average toppings included
- Monthly site fee of USD 700
- Monthly service labor and travel of USD 300
- Monthly electricity of USD 70
- Monthly maintenance reserve of USD 120
| Cost Item | Monthly Cost | Cost Per Serving |
| Base mix | USD 720 | USD 0.40 |
| Cups and spoons | USD 180 | USD 0.10 |
| Toppings | USD 270 | USD 0.15 |
| Waste allowance | USD 72 | USD 0.04 |
| Payment charges | USD 396 | USD 0.22 |
| Electricity | USD 70 | USD 0.04 |
| Refill and cleaning labor | USD 300 | USD 0.17 |
| Site fee | USD 700 | USD 0.39 |
| Connectivity | USD 30 | USD 0.02 |
| Maintenance reserve | USD 120 | USD 0.07 |
| Illustrative total | USD 2,858 | Approximately USD 1.59 |
This example excludes:
- Original machine purchase
- Shipping and import
- Financing
- Income tax
- Business administration
- Major unexpected repair
- Owner’s management time
The purpose is to show the calculation structure. Every number should be replaced with local project data.
How Volume Changes the Same Cost Structure
Assume fixed and semi-fixed monthly costs of USD 1,220 for site fee, labor, electricity, connectivity and maintenance.
| Monthly Sales | Fixed and Semi-Fixed Cost Per Cup |
| 500 cups | USD 2.44 |
| 1,000 cups | USD 1.22 |
| 1,800 cups | USD 0.68 |
| 3,000 cups | USD 0.41 |
This table does not predict sales or profit. It demonstrates why traffic assumptions matter.
A machine in a lower-volume location can have a high cost per serving even when its ingredient price is low. A busier machine can distribute fixed expenses across more transactions, provided that refill capacity, product quality and service reliability remain adequate.
How Location Type Changes the Calculation
| Location Type | Major Cost Driver | Information Needed Before Quoting |
| Shopping mall | Rent, revenue share, branding and payment | Foot traffic, lease terms, access hours |
| FEC | Peak demand, cups, toppings and refill frequency | Weekend volume and event schedule |
| Hotel | Appearance, quiet operation and moderate demand | Guest profile and operating hours |
| Campus | Payment compatibility and calendar seasonality | Student payment method and term dates |
| Gym | Recipe and premium topping cost | Product positioning and target portion |
| Tourist site | Seasonality and service distance | Peak months and local support access |
| Distributor rollout | Logistics, spare parts and training | Quantity, cities and support structure |
The supplier cannot determine the correct configuration from the country alone. Point-of-sale conditions affect capacity, payment, screen requirements, refill frequency and service planning.
How Purchase Quantity Affects the Quote and Cost Model
One Machine
A one-machine pilot normally has:
- Higher shipping cost per unit
- Limited route efficiency
- One-machine spare-parts exposure
- Less volume purchasing leverage
- Greater dependence on one location
It can still be the right way to validate a project.
Three to Five Machines
At this stage, the buyer should consider:
- Shared spare parts
- Centralized remote management
- Service routes
- Consistent cup and ingredient supply
- Location comparison
- Standard cleaning procedures
The cost per serving may improve if several locations share labor and inventory efficiently.
Ten or More Machines
A larger project may benefit from:
- Container-based shipping
- Volume purchasing
- Local spare-parts inventory
- Centralized training
- Standardized payment setup
- Better consumable purchasing terms
However, scale also adds warehousing, management and local service responsibilities. A lower machine price does not automatically produce a lower fully loaded cost per serving.
Why a Base Machine Price Is Not an Accurate Quote
An accurate ice cream vending machine quote requires the supplier to understand:
- Which machine format fits the location
- Expected daily and peak demand
- Required payment methods
- Product type
- Cup and topping plan
- Destination
- Order quantity
- Trade term
- Branding
- Remote management
- Compliance documents
- Spare-parts support
Without this information, the supplier can only issue a preliminary base quotation.
That quotation may exclude:
- Payment terminal
- Local payment integration
- Export packaging
- Shipping
- Duty and tax
- Destination fees
- Spare parts
- Branding
- Initial cups
- Training
- Software or network charges
Buyers should compare quotations line by line, not only by total value.
Accurate Quote Checklist
Buyer and Destination
- Company name
- Country
- Destination city
- Destination port
- Full delivery address when needed
- Import experience
- Preferred trade term
Project Scale
- Initial quantity
- Pilot or rollout
- Planned future quantity
- Target launch date
- Expected number of locations
Location
- Mall, FEC, hotel, campus, gym or other
- Indoor or outdoor
- Available space
- Access hours
- Estimated daily sales
- Estimated peak-hour demand
- Distance from service base
Product
- Soft serve, frozen yogurt, sorbet or açaí-style
- Cup size
- Toppings
- Ingredient source
- Target portion
- Menu language
Payment and Software
- Card
- NFC
- QR
- Coin
- Bill
- Local wallet
- Local payment provider
- Remote management needs
- Data or API requirements
Logistics and Support
- FOB, CIF, DAP or DDP
- Port or door delivery
- Spare-parts package
- Initial cups or ingredients
- Training
- Certification or document requirements
- Local technical support plan
Quote Request Template
Company Name:
Country:
Destination City or Port:
Complete Delivery Address, if required:
Initial Purchase Quantity:
Future Expansion Plan:
Project Type: Pilot / Operator / Distributor / Commercial Project
Location Type: Mall / FEC / Hotel / Campus / Gym / Tourist Site / Other
Indoor or Outdoor:
Available Space:
Expected Daily Sales:
Expected Peak-Hour Demand:
Product Type: Soft Serve / Frozen Yogurt / Sorbet / Açaí-Style
Cup Size:
Topping Requirements:
Local Ingredient Source Identified: Yes / No
Payment Methods Required:
Local Payment Provider, if known:
Required Language:
Remote Management Requirements:
Voltage and Frequency:
Branding Requirements:
Required Certifications or Documents:
Preferred Trade Term: FOB / CIF / DAP / DDP / Need Advice
Port or Door Delivery:
Need Initial Cups or Ingredients:
Need Spare-Parts Package:
Need Technical Training:
Planned Launch Date:
Other Requirements:
This information helps the supplier recommend an appropriate configuration and prepare a quotation with clear boundaries.
FAQ
What is a typical ice cream vending machine cost per serving?
There is no universal figure. It depends on the recipe, cup size, toppings, waste, payment fees, electricity, labor, site cost, maintenance and monthly sales volume. A useful calculation must use local inputs.
Does the machine quotation include ingredients and paper cups?
Not automatically. Some suppliers may quote starter consumables separately. The buyer should confirm whether cups, spoons, mix, toppings and cleaning supplies are included.
Does the machine price include shipping and import tax?
Only when the quotation and trade term explicitly say so. FOB, CIF and DDP cover different responsibilities. Destination charges, duty, VAT or GST and local delivery should be listed separately.
How do I calculate the base mix cost per cup?
Add the complete prepared-batch cost and divide it by the number of saleable cups produced. Use real yield after waste rather than the theoretical maximum.
Does buying more machines reduce the cost per serving?
It can improve shipping, spare-parts purchasing, consumable sourcing and service-route efficiency. It does not guarantee a lower cost if locations perform poorly or management costs increase.
How does remote management reduce cost?
It can reduce unnecessary inspection visits, identify faults earlier and improve refill planning. It does not replace physical cleaning, replenishment or repairs.
What information is most important for an accurate quote?
The supplier needs the country, destination, quantity, location type, product type, payment requirements, expected daily sales, preferred trade term and launch date.
Should machine depreciation be included in cost per serving?
Include it when calculating fully loaded cost or capital recovery. Keep it separate when evaluating only direct product and operating cost so that the model remains clear.
Conclusion: Use Cost Per Serving to Test the Whole Project
The ice cream vending machine cost per serving is more useful than a machine price when evaluating the long-term operating model.
It shows whether the recipe, location, service plan and site agreement work together. It also reveals why two machines using similar ingredients can produce very different commercial outcomes.
A complete calculation should include:
- Base mix
- Cups and spoons
- Toppings
- Waste
- Payment fees
- Electricity
- Refill and cleaning labor
- Site cost
- Maintenance reserve
- Connectivity
- Capital allocation when required
The quality of the calculation depends on the quality of the information provided.
Before requesting a quotation, prepare the country, destination, quantity, point type, product category, payment requirements, expected daily sales and launch date. This allows the supplier to recommend the right configuration and quote the actual project rather than sending a generic base price.
References / Sources
-
WebstaurantStore, “Frostline Vanilla Soft Serve Ice Cream Mix, 6 lb., 6/Case,” public price and yield information checked July 31, 2026.
-
WebstaurantStore, “Choice 6 oz. White Paper Frozen Yogurt / Food Cup, 1,000/Case,” public price information checked July 31, 2026.
-
U.S. Energy Information Administration, “Electric Power Monthly,” commercial electricity price data through May 2026.
-
U.S. Bureau of Labor Statistics, “Food Services and Drinking Places: NAICS 722,” 2025 occupational wage data.