Ice Cream Vending Machine Profitability and ROI: Realistic Calculation Guide for Operators
Learn how to calculate ice cream vending machine profitability, break-even sales, ROI and payback period using realistic assumptions for sales, ingredients, rent, labor and operating costs.
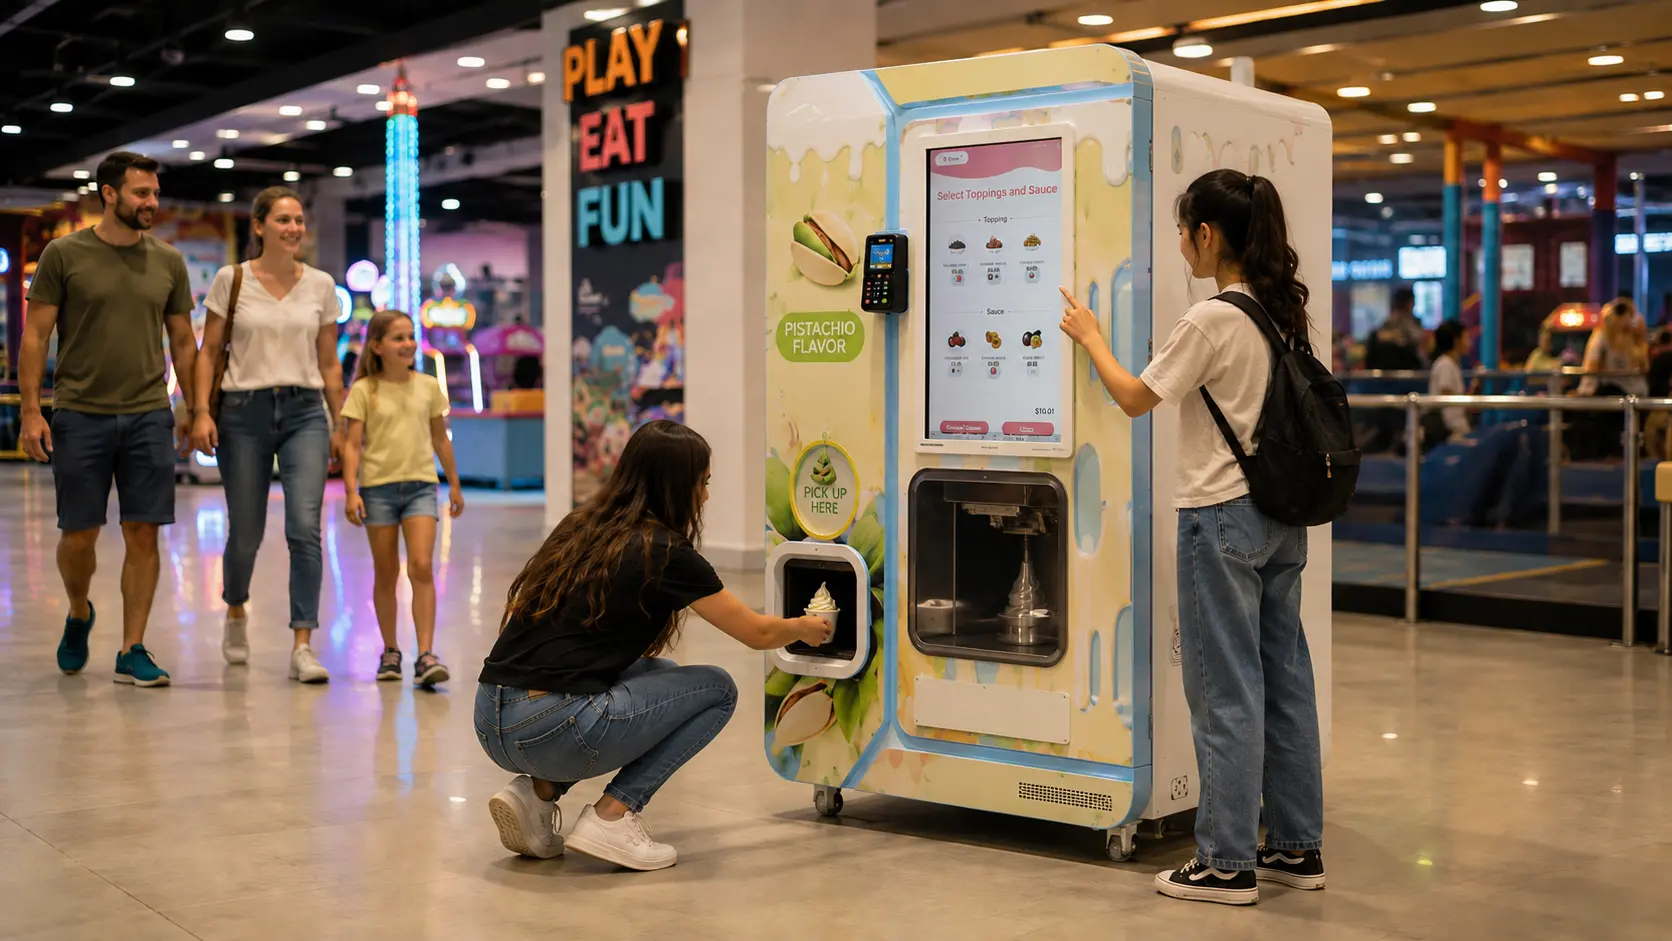
Ice cream vending machine profitability should never be calculated by subtracting ingredient cost from the selling price and calling the difference “profit.”
That shortcut ignores some of the expenses that have the greatest effect on a real project: site rent or revenue share, payment fees, refilling labor, electricity, cleaning, maintenance, product waste, downtime and the original capital invested in the machine.
It also ignores the most uncertain variable of all: how many cups the location will actually sell.
A machine capable of producing a serving in approximately 15–20 seconds may have enough technical capacity for a busy location, but production capability does not create customer demand. A hotel lobby, shopping mall, university campus, tourist attraction and family entertainment center can produce very different sales patterns even when the same machine and menu are used.
For that reason, a realistic ROI study should start with a business model, not a promised payback period.
The key questions are:
How many customers are realistically likely to buy each day?
What will they pay?
What does each serving cost?
Which expenses increase with every sale?
Which expenses remain even during a slow month?
How much capital is tied up in the project?
How sensitive is the result if sales are 20% lower than expected?
Those questions produce a decision model. A statement such as “the machine pays back in six months” does not.
Profitability Starts With the Contribution Margin
The simplest useful profitability formula is:
Contribution per cup = Selling price − Variable cost per cup
Variable costs normally include expenses directly associated with each transaction:
Base mix
Cup and spoon
Toppings
Product waste allowance
Payment processing cost
Other sale-linked consumables
Suppose an illustrative project sells one cup for USD 4.50 and has variable costs of USD 1.80.
The contribution per cup would be:
USD 4.50 − USD 1.80 = USD 2.70
That USD 2.70 is not profit.
It still has to cover:
Site rent
Refilling labor
Cleaning
Travel
Electricity
Network costs
Maintenance
Insurance
Administration
Capital recovery
Only after those expenses are covered does the project begin generating an operating surplus.
The Four Numbers That Matter Most
Variable | What It Means | Why It Matters |
|---|---|---|
Daily cup sales | Number of paid servings | Usually the biggest ROI sensitivity |
Average selling price | Revenue per transaction | Determines revenue and contribution |
Variable cost per cup | Product and transaction cost | Determines contribution margin |
Monthly fixed operating cost | Rent, labor, electricity, service, etc. | Determines break-even volume |
The equipment price matters to payback and ROI, but these four variables determine whether the operating model works in the first place.
Do Not Use a Global “Average Selling Price”
Selling price should be researched locally.
Even major soft serve brands do not use one universal global price. Dairy Queen Canada currently lists a small vanilla cone under its “Everyday Value Under $4” offer at participating locations, while the U.S. Dairy Queen site directs customers to their local store for pricing. That is a useful reminder that product price varies by market, site and operator rather than following a universal benchmark.
A vending operator should check the actual competitive set around the proposed location:
Soft serve kiosks
Frozen yogurt shops
Convenience stores
Cafés
Dessert counters
Cinema concessions
FEC food outlets
Nearby vending concepts
The correct selling price should reflect both local willingness to pay and the product being offered.
A plain soft serve cup and an açaí-style dessert with premium toppings should not automatically use the same pricing assumption.
Ingredient Cost Must Be Calculated From Real Yield
Ingredient cost is another area where optimistic ROI models often go wrong.
The correct calculation is:
Base ingredient cost per cup = Prepared batch cost ÷ Actual saleable servings
A current U.S. foodservice reference provides a useful example of the method. WebstaurantStore lists a six-bag case of Frostline vanilla soft serve mix at USD 86.99 for one to two cases, with a lower quantity price for larger purchases. The manufacturer information on the listing states that each bag is mixed with two gallons of water and yields approximately 88 servings of two-thirds of a cup.
That means the dry-mix cost appears low when divided by the theoretical serving yield.
But an ROI calculation still needs to add:
Water or milk where required
Local freight
Cup
Spoon
Toppings
Overfilling
Recipe testing
Cleaning loss
Unsold product
Ingredient spoilage
Theoretical yield should therefore be treated as a starting point, not the final cost per cup.
Build the Profit Model in the Correct Order
A useful profitability calculation can be built in five steps.
Step 1: Monthly Sales Volume
Monthly cups = Average daily cups × Operating days
If a machine averages 45 cups per day and operates for 30 days:
45 × 30 = 1,350 cups per month
This is an assumption until the location produces real sales data.
Step 2: Monthly Revenue
Monthly revenue = Monthly cups × Average selling price
Using an illustrative USD 4.50 selling price:
1,350 × USD 4.50 = USD 6,075
Step 3: Variable Costs
Monthly variable cost = Monthly cups × Variable cost per cup
If the hypothetical variable cost is USD 1.80:
1,350 × USD 1.80 = USD 2,430
Step 4: Monthly Operating Contribution
Assume monthly fixed operating expenses of USD 2,800.
Operating contribution = Revenue − Variable costs − Fixed operating costs
Therefore:
USD 6,075 − USD 2,430 − USD 2,800 = USD 845
This is still not necessarily accounting profit. Financing, depreciation, corporate overhead and tax may still need to be considered.
Step 5: Payback and ROI
If the hypothetical total initial project investment is USD 30,000:
Simple payback = Initial project investment ÷ Monthly operating contribution
USD 30,000 ÷ USD 845 ≈ 35.5 months
Simple annual ROI can be expressed as:
Annual ROI = Annual operating contribution ÷ Initial project investment × 100
In this illustrative scenario:
USD 845 × 12 = USD 10,140 annual operating contribution
USD 10,140 ÷ USD 30,000 ≈ 33.8%
Every number in this example is hypothetical. It is not a Huaxin customer result, a recommended selling price or a predicted return.
Its purpose is to demonstrate the method.
Illustrative ROI Model
The following model deliberately uses conservative enough inputs to demonstrate how sensitive ROI is to volume.
Hypothetical assumptions:
Selling price: USD 4.50
Variable cost per cup: USD 1.80
Monthly fixed operating cost: USD 2,800
Operating days: 30
Initial project investment: USD 30,000
Daily Sales | Monthly Cups | Monthly Revenue | Variable Cost | Fixed Cost | Operating Contribution | Simple Payback |
35 cups | 1,050 | USD 4,725 | USD 1,890 | USD 2,800 | USD 35 | Extremely long |
45 cups | 1,350 | USD 6,075 | USD 2,430 | USD 2,800 | USD 845 | ~35.5 months |
55 cups | 1,650 | USD 7,425 | USD 2,970 | USD 2,800 | USD 1,655 | ~18.1 months |
The machine, product and selling price have not changed.
Only daily sales changed.
That is why location quality can matter more to ice cream vending machine ROI than a small discount on the equipment purchase.
The example also illustrates why a seller promising a fixed payback period without knowing the buyer’s sales volume, rent and operating expenses is not providing a serious financial model.
Calculate the Break-Even Daily Sales
Break-even analysis is often more useful than asking for an ROI percentage.
The formula is:
Monthly break-even cups = Monthly fixed costs ÷ Contribution per cup
Using the hypothetical figures above:
Selling price = USD 4.50
Variable cost = USD 1.80
Contribution = USD 2.70
Fixed operating costs = USD 2,800
Monthly break-even volume:
USD 2,800 ÷ USD 2.70 ≈ 1,037 cups
Daily break-even at 30 operating days:
1,037 ÷ 30 ≈ 35 cups per day
This means the project must sell roughly 35 cups per day in this specific hypothetical model before generating a meaningful operating surplus.
Change the rent, selling price or ingredient cost and the break-even point changes immediately.
Sales Volume Should Be Estimated From the Location
Instead of asking “How many cups does a vending machine normally sell?”, operators should estimate demand from the proposed site.
A simple framework is:
Expected daily sales = Relevant customer traffic × Expected purchase conversion
For example, consider a hypothetical location with 2,000 people passing through the relevant machine zone each day.
If 2.5% make a purchase:
2,000 × 2.5% = 50 cups per day
This does not mean 2.5% is an industry-standard conversion rate. It is a scenario input that must be tested.
A proper site model should create at least three assumptions:
Conservative
Base case
Strong case
Then test what happens to profitability under each.
How Different Locations Change the ROI Model
Different locations should not be evaluated with the same assumptions.
Location | Potential Strength | Main Financial Risk | What to Measure |
Shopping mall | Consistent consumer traffic | High rent or revenue share | Traffic near machine, weekend sales, rent |
FEC | Strong family and impulse demand | Weekend concentration | Event calendar, peak hours, toppings |
Campus | Repeat users | Vacation and academic seasonality | Term dates, weekday demand, payment preferences |
Tourist attraction | Strong seasonal peaks | Large off-season decline | Monthly visitor pattern and weather |
Hotel | Long operating hours | Lower transaction volume | Guest occupancy, late-night demand |
Gym | Targeted product positioning | Narrower audience | Membership traffic and menu fit |
Shopping Mall
A mall may create enough visibility to support strong sales, but an expensive lease can increase the break-even volume significantly.
A machine selling 60 cups per day under a high fixed rent could generate less operating surplus than a 40-cup location with a favorable site agreement.
Campus
Campus locations may offer repeat customers and predictable weekday traffic, but holidays and semester breaks can distort annual averages.
An ROI model should forecast each month separately rather than multiplying a strong school-month result by twelve.
Tourist Attraction
Tourist locations may produce very strong peak periods and weak off-season periods.
Annual profitability therefore depends on seasonality, not the best summer month.
FEC
Family entertainment centers can be attractive because ice cream fits the customer profile and demand may peak during weekends, parties and holidays.
The key questions are whether machine capacity, refill scheduling and topping inventory can support those concentrated demand periods.
Hotel
Hotels can provide convenient unattended access without requiring continuous staff, but volume may be lower than in a large mall or FEC.
A lower-volume hotel can still work if the site cost is also lower.
Machine Speed Is Capacity, Not a Sales Forecast
Huaxin’s full-size automatic platform can typically produce a serving in approximately 15–20 seconds depending on the recipe and operating conditions.
That tells an operator whether the machine can physically support a stream of orders.
It does not mean:
60 minutes ÷ 15 seconds = 240 sales per hour
Real customers need time to:
Approach the machine
Read the menu
Make a selection
Complete payment
Wait for production
Collect the cup
Demand is also irregular.
The production cycle should therefore be used to test whether the equipment has enough capacity for expected peak demand—not to create an artificial revenue forecast.
Payment Costs Matter More on Low-Ticket Products
Card and digital-payment fees can materially affect low-value transactions.
For example, Stripe’s standard U.S. online domestic-card pricing currently lists 2.9% plus USD 0.30 per successful transaction. Actual vending-payment providers, terminal agreements and countries use different pricing structures, but the example shows why a fixed per-transaction fee matters more on a USD 4 product than on a USD 40 product.
Operators should obtain the real rate from the local vending payment provider and include:
Percentage fee
Fixed transaction fee
Terminal rental
SIM or data cost
Gateway fee
Settlement charges
Refund cost
Payment cost should be entered into the ROI model before the selling price is finalized.
Labor Is Reduced, Not Eliminated
Automatic vending does not require an employee to stand behind the machine all day.
It still requires:
Ingredient refilling
Cup replenishment
Topping refill
Cleaning
Fault response
Routine inspection
Travel to the site
U.S. Bureau of Labor Statistics data published in May 2026 shows that food preparation and serving-related occupations had a national mean hourly wage of USD 17.86 and a median of USD 16.85 in May 2025.
This is not a global labor-cost assumption. Employer cost can also exceed the employee wage after payroll costs, insurance, supervision and travel.
The correct labor calculation is:
Monthly service labor = Total monthly service hours × Loaded hourly labor cost
For multi-location operators, route design becomes important. Five machines located close together may require less service time per machine than three machines spread across different cities.
Electricity Usually Matters Less Than Rent or Volume—But Measure It
Electricity should be measured rather than estimated from rated machine power.
The U.S. Energy Information Administration reports that the average U.S. commercial electricity price for January through May 2026 was 13.79 cents per kWh, with May itself at 13.54 cents.
This figure varies widely by location and should not be used directly for Europe, Australia, the Middle East or other markets.
Operators should record actual machine consumption and use:
Monthly electricity cost = Measured kWh × Local tariff
Electricity often receives too much attention because it is easy to calculate, while rent and sales volume receive too little attention even though they can have much larger effects on the final ROI.
Location Rent and Revenue Share Can Change the Entire Model
There is no responsible global benchmark for “normal mall rent” or “normal vending revenue share.”
The commercial terms depend on:
Country
City
Property
Exact machine position
Traffic
Contract length
Operator negotiating power
Electricity inclusion
Promotional support
Exclusivity
Site agreements may use:
Fixed monthly rent
Revenue share
Minimum guarantee
Fixed rent plus percentage
Utility charges
Marketing charges
Use the actual site offer in the financial model.
Do not copy a percentage found online and assume it applies to a shopping center in another country.
Common Factors That Destroy an Attractive ROI Model
Overestimating Daily Sales
This is the most obvious risk.
A spreadsheet can make almost any project look profitable by increasing daily cup sales.
The base case should be defensible from traffic data and comparable food purchases.
Ignoring Seasonality
A summer month should not automatically be multiplied by twelve.
Use monthly projections.
Choosing a Location Based on Traffic Alone
High traffic does not always mean relevant traffic.
Customer demographics, visibility, dwell time and willingness to purchase dessert matter.
Setting the Price Too Low
A low price can increase purchase conversion but reduce contribution per transaction.
It also makes fixed payment fees more significant.
Underestimating Waste
Product discarded during testing, cleaning, recipe changes or slow periods should be measured.
Paying Too Much for the Location
A strong location can still have poor economics if rent absorbs the contribution margin.
Ignoring Refill Travel
Travel can become one of the most important labor expenses in a dispersed network.
No Spare Parts on Hand
A small component failure can cause disproportionately expensive downtime if the operator must wait for an international shipment.
Treating Remote Management as Optional at Scale
For a single machine nearby, manual inspection may be manageable.
For a fleet, remote sales, status and fault information can reduce unnecessary visits and help prioritize service.
Huaxin remote management can support these operational decisions, but remote monitoring does not replace physical refill, cleaning or repair work.
A More Useful Way to Calculate Payback
The simplest payback calculation is:
Payback months = Initial project investment ÷ Average monthly operating cash contribution
But using one month as “average” can be dangerous.
A better approach is to forecast month by month:
Month | Planned Cups | Revenue | Operating Cost | Operating Contribution | Cumulative Recovery |
Month 1 |
|
|
|
|
|
Month 2 |
|
|
|
|
|
Month 3 |
|
|
|
|
|
Month 4 |
|
|
|
|
|
Month 5 |
|
|
|
|
|
Month 6 |
|
|
|
|
|
Month 7 |
|
|
|
|
|
Month 8 |
|
|
|
|
|
Month 9 |
|
|
|
|
|
Month 10 |
|
|
|
|
|
Month 11 |
|
|
|
|
|
Month 12 |
|
|
|
|
|
This structure captures:
Summer peaks
School holidays
Tourist seasons
Opening ramp-up
Site changes
Ingredient-price changes
A cumulative cash-flow model is more informative than a headline payback number.
ROI Planning Template
Project Country:
Location Type:
Number of Machines:
Operating Days per Month:
Expected Daily Cups — Conservative Case:
Expected Daily Cups — Base Case:
Expected Daily Cups — Strong Case:
Average Selling Price per Cup:
Base Ingredient Cost per Cup:
Cup and Spoon Cost:
Average Topping Cost:
Waste Allowance per Cup:
Payment Cost per Transaction:
Total Variable Cost per Cup:
Monthly Site Rent:
Revenue Share, if applicable:
Monthly Refill and Cleaning Labor:
Monthly Travel Cost:
Monthly Electricity:
Monthly Connectivity:
Monthly Maintenance Reserve:
Other Fixed Operating Expenses:
Initial Equipment and Setup Investment:
Contribution per Cup:
Monthly Break-Even Cups:
Daily Break-Even Cups:
Estimated Monthly Operating Contribution:
Illustrative Annual Operating Contribution:
Illustrative ROI:
Illustrative Payback Period:
All outputs from this template should be treated as estimates until actual sales and expense data are available.
Profitability Evaluation Checklist
Before deciding that a project is financially attractive, confirm:
The daily sales estimate is based on the actual site
The selling price has been checked against local alternatives
Ingredient yield is based on the intended portion
Cups and toppings are included
Payment fees are included
Product waste is included
Rent or revenue share is confirmed in writing
Refill labor includes travel
Electricity uses a local rate
A maintenance reserve is included
Seasonal months are modeled separately
Downtime risk has been considered
Spare parts are available
Low, base and high sales scenarios have been tested
Payback is based on cash contribution, not gross sales
ROI assumptions can be updated after launch
A model that cannot survive a conservative scenario deserves further testing before a large rollout.
FAQ
How profitable is an ice cream vending machine?
There is no universal profit figure. Profitability depends mainly on daily sales, selling price, variable cost per serving, site costs, service efficiency and the original investment. Two identical machines can have very different financial results in different locations.
How long does an ice cream vending machine take to pay back?
There is no responsible fixed answer. Payback should be calculated from the total initial investment and the actual monthly operating cash contribution. A project selling slightly above break-even can take years to recover its investment, while a strong location can recover capital much faster.
How many cups per day are needed to be profitable?
Calculate:
Daily break-even cups = Monthly fixed operating costs ÷ Contribution per cup ÷ Operating days
The result will be different for every location.
Which locations tend to produce the best ROI?
No location type automatically guarantees the best ROI. Malls and FECs may offer higher demand but also higher site costs. Hotels may produce lower volume with lower rent. Tourist locations may be strong but seasonal. The economics of the specific site matter more than the label.
Is soft serve vending machine profit mainly determined by ingredient cost?
No. Ingredient cost is only one component. Rent, volume, payment fees, labor, waste and downtime can have a larger effect on the final result.
Does faster serving speed improve ROI?
It can prevent production capacity from becoming a bottleneck during busy periods, but it does not create demand. Serving speed should be matched to expected peak traffic.
Can remote management increase profitability?
It can improve operating efficiency by reducing unnecessary site visits and helping operators identify refill needs or faults earlier. Its value generally increases as the number and geographic spread of machines increase.
Should I calculate ROI before buying the machine?
Yes. Build conservative, base and strong scenarios before committing to the location and equipment configuration. Update the model with actual data after the machine begins operating.
Conclusion: ROI Is a Location Model, Not a Machine Promise
The most useful way to think about ice cream vending machine profitability is not:
“How much profit can this machine make?”
It is:
“What must this specific location sell, at this price and cost structure, for the project to meet my investment target?”
A realistic model starts with:
Daily sales
Selling price
Variable cost per cup
Site costs
Labor and service
Payment fees
Electricity
Maintenance
Total initial investment
It then tests several sales scenarios instead of assuming the strongest one will occur.
Production capacity, automation, remote management and cleaning functions can support an efficient operation, but they cannot compensate for a weak location or unrealistic revenue assumptions.
For a project-specific evaluation, prepare your country, proposed location type, expected number of machines, product category, estimated daily cup sales, intended selling price, payment requirements and planned launch date.
Those inputs make it possible to discuss the right machine configuration and build a more defensible ROI model—without relying on exaggerated profit claims or a guaranteed payback period.
References / Sources
U.S. Bureau of Labor Statistics, National Employment and Wage Data by Occupation — May 2025, published May 15, 2026. Food preparation and serving-related occupations: mean hourly wage USD 17.86; median USD 16.85.
U.S. Energy Information Administration, Electric Power Monthly — May 2026. U.S. commercial electricity price: 13.79 cents/kWh year-to-date through May 2026.
WebstaurantStore, Frostline Vanilla Soft Serve Ice Cream Mix, 6 lb., 6/Case. Public listing checked August 2026; USD 86.99 per case for 1–2 cases, with six bags per case and approximately 88 listed servings per bag.
Stripe, Pricing & Fees — United States. Standard domestic card example: 2.9% + USD 0.30 per successful transaction. Actual vending payment pricing varies by provider and market.
Dairy Queen Canada, Vanilla Cone — Everyday Value. Small vanilla cone currently positioned under CAD 4 at participating locations; local pricing applies.