Ice Cream Vending Machine Business Plan and Opportunity Evaluation
Build a practical ice cream vending machine business plan covering market opportunity, business models, location strategy, financial projections, risk analysis, pilot testing and multi-location expansion.
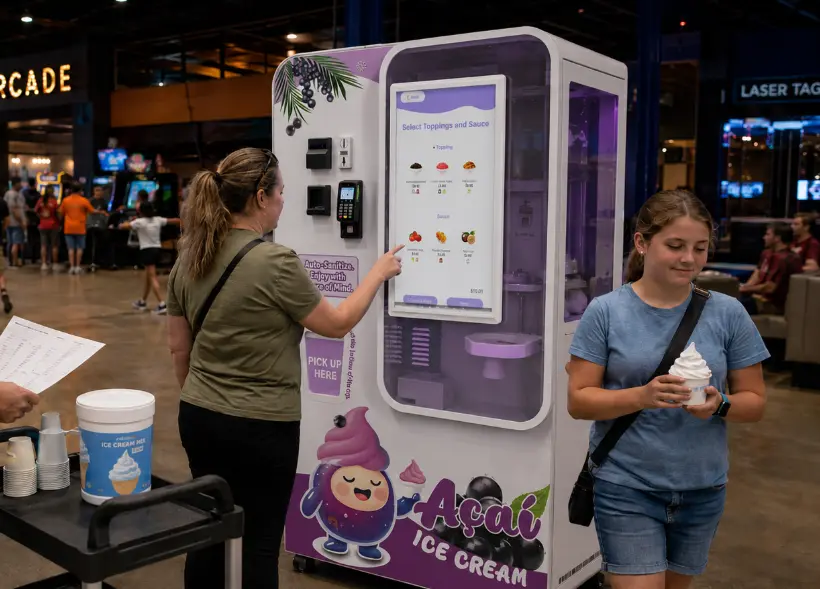
An ice cream vending machine business plan should do more than describe the equipment and estimate a possible return. Its real purpose is to test whether the opportunity is strong enough to justify the investment.
That requires more than a market-growth chart. The customer has to exist in a measurable location. The product has to fit that customer. The selling price has to support the operating costs. Payment, cleaning, refilling and service all have to work in the real environment. Only then does it make sense to ask how many machines the model could support.
The broader market provides useful context. NAMA's 2024–2025 State of Convenience Services census estimates U.S. convenience-services revenue at about USD 31.1 billion in 2025, up from approximately USD 26.6 billion in 2023, with vending remaining the industry's largest business line.
That tells us unattended food and beverage retail is already an established commercial channel. It does not tell us whether a particular soft serve machine will succeed in a particular mall, family entertainment center or campus.
For a new operator, the exact location usually matters far more than another national market forecast.
1. Start With the Location, Not the Market Size
“People like ice cream” is not an investment thesis.
A stronger starting point is something specific enough to test:
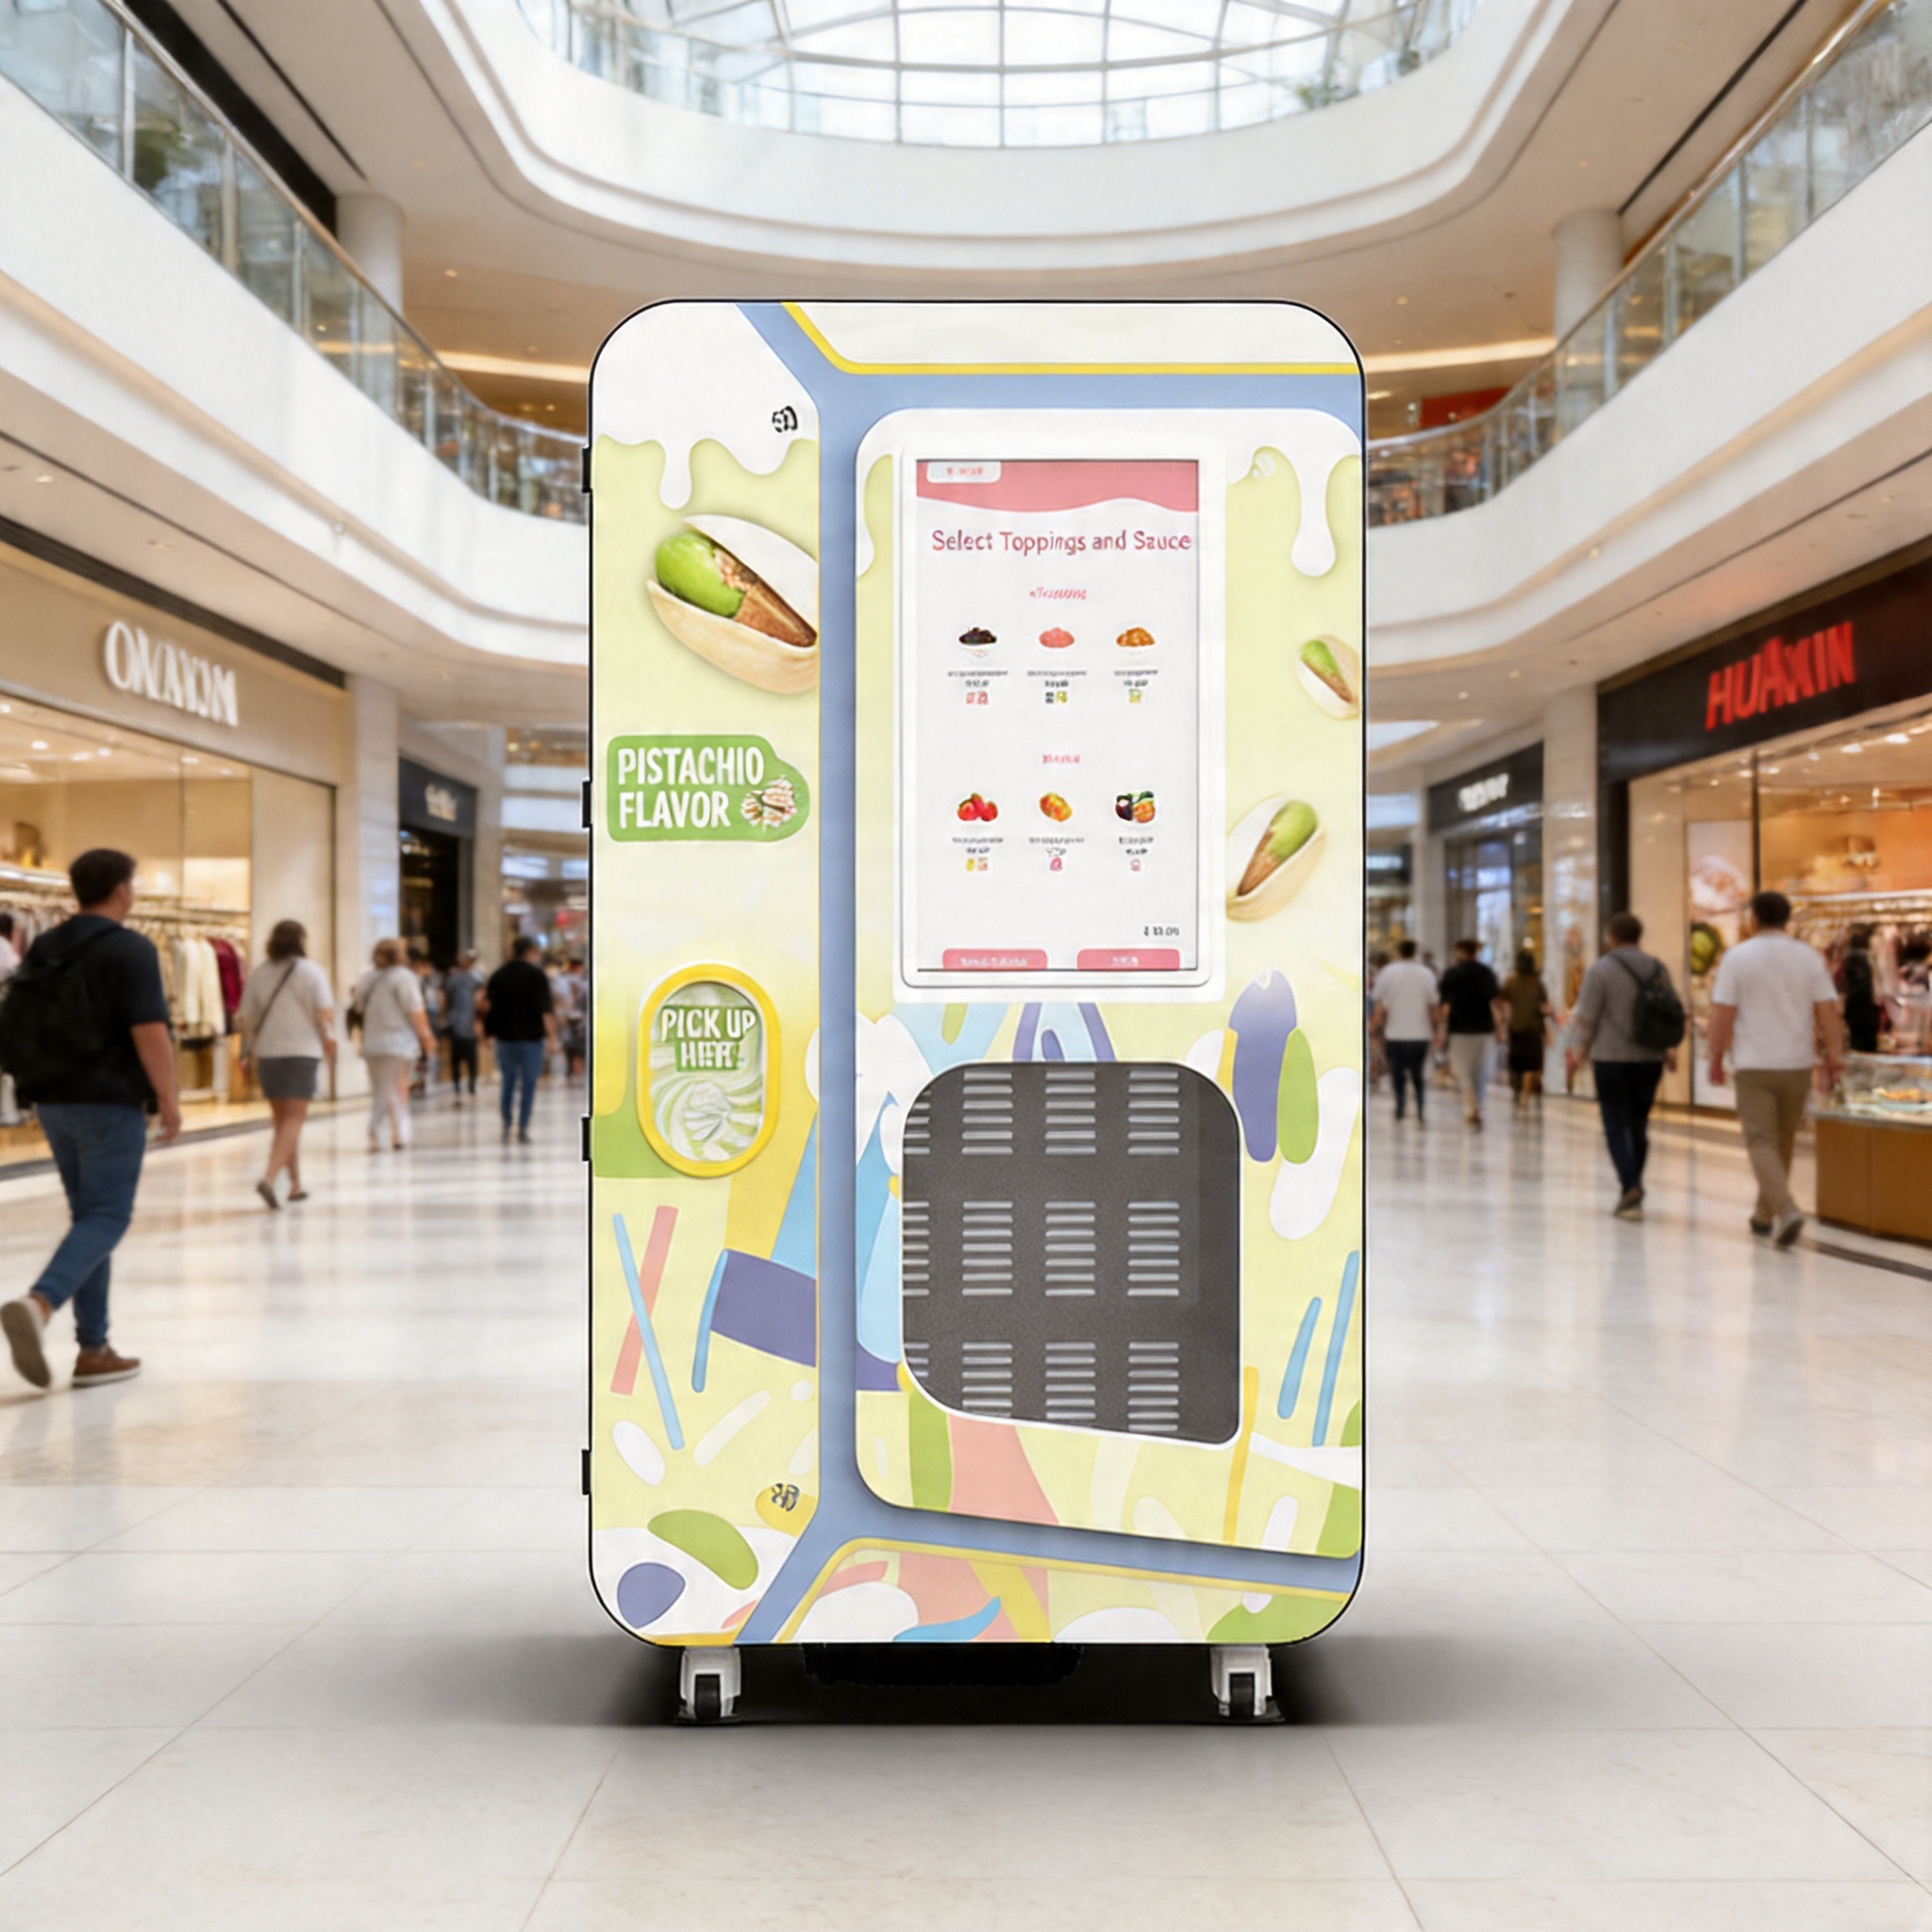
We plan to operate unattended soft serve points in family entertainment centers where customers have long dwell times, dessert demand already exists, and the venue does not want to operate another staffed food counter.
That statement defines the customer, location, product and operating advantage.
From there, market research should become increasingly local. The U.S. Small Business Administration recommends evaluating factors such as demand, location, market saturation, customer characteristics and competitor pricing. Those questions translate naturally into vending-location analysis.
Before considering a site, check whether frozen desserts are already purchased there, what nearby alternatives cost, whether demand is mainly impulse-driven, and how strongly traffic changes between weekdays, weekends and seasons.
Then look at the exact proposed machine position.
A useful location review might look like this:
| Factor | What Matters |
|---|---|
| Relevant traffic | People who actually pass the proposed position |
| Product fit | Evidence that the audience buys desserts or impulse food |
| Visibility | Whether the machine can be seen naturally |
| Dwell time | Whether customers remain in the venue long enough to buy |
| Competition | Nearby ice cream, drinks, snacks or dessert counters |
| Site economics | Rent, revenue share or minimum guarantee |
| Service access | Refilling, cleaning and maintenance access |
| Payment environment | Compatibility with local customer habits |
| Seasonality | Stability of demand across the year |
| Expansion potential | Whether similar locations can be acquired later |
A busy property can still be a poor location if the machine is hidden, the audience is wrong or the site cost is too high.
That is why “high traffic” should never be accepted as a complete location strategy.
2. Decide What Business You Are Actually Building
The same machine can support very different business models.
An independent operator earns from retail sales and takes responsibility for locations, ingredients, cleaning, refilling, payments and service.
A location-partnership model works similarly, except the venue may receive fixed rent, revenue share or another negotiated consideration.
A multi-site operator eventually has to think about route density, standardized payment, spare parts, inventory and remote fleet management.
A distributor is different again. The main business is equipment sales and local support, so success depends more on sales pipeline, demonstrations, technician capability, spare-parts availability, training and customer acquisition.
Trying to combine all of these into one financial model usually produces a plan that looks comprehensive but explains very little.
Choose the primary model first. The economics, operating plan and expansion path should follow from that decision.
3. Make the Product and Machine Fit the Operating Model
The product section does not need to become a catalogue, but it does need to be specific.
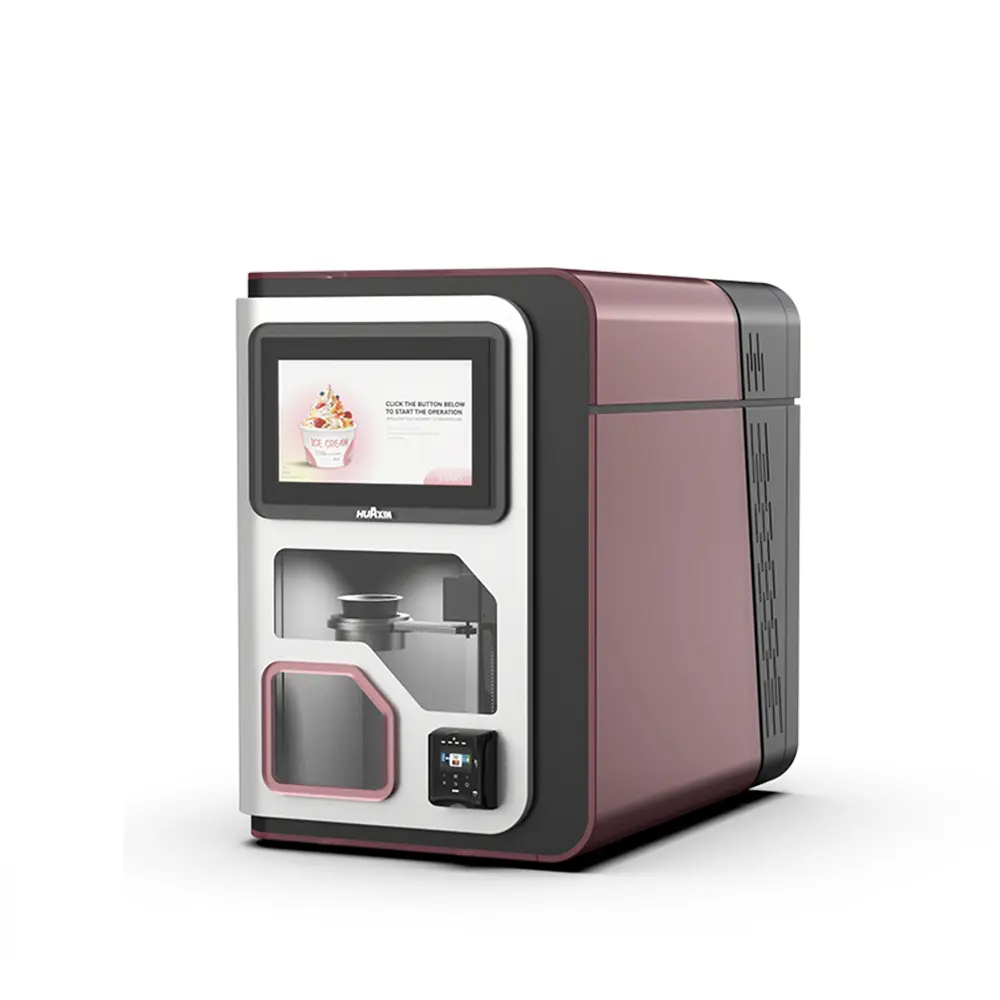
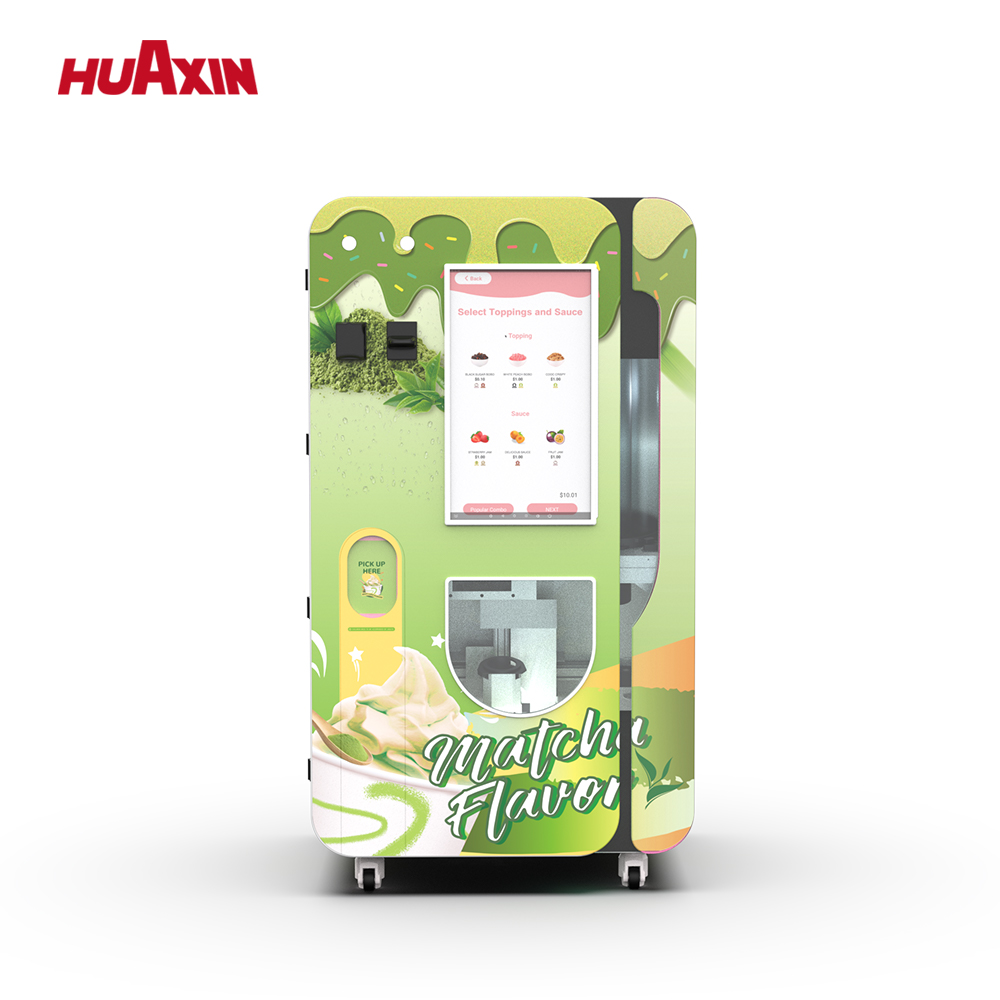
Huaxin full-size vending platforms can work with product categories such as soft serve, frozen yogurt, sorbet and Açaí-style frozen dessert. They generally operate with one base product at a time. Changing product categories means changing the base ingredient and recipe rather than selling several unrelated bases simultaneously.
That matters because product choice affects ingredient sourcing, food cost, serving price, cleaning, customer expectations and seasonal demand.
The machine specifications should then be interpreted as operating variables rather than sales claims.
A typical Huaxin full-size platform can complete a serving in approximately 15–20 seconds, depending on the recipe and operating conditions. Typical configurations can hold about 160 cups and approximately 20 L of mix.
Those numbers help estimate peak throughput and refill frequency. They do not tell you how many customers will buy.
The same distinction applies to automation. Remote management becomes more valuable as the fleet grows because the operator can review machine status, sales information, inventory-related alerts and faults without relying entirely on physical inspection. Automated cleaning and pasteurization can standardize parts of the sanitation and temperature-management process, but they do not mean zero manual cleaning.
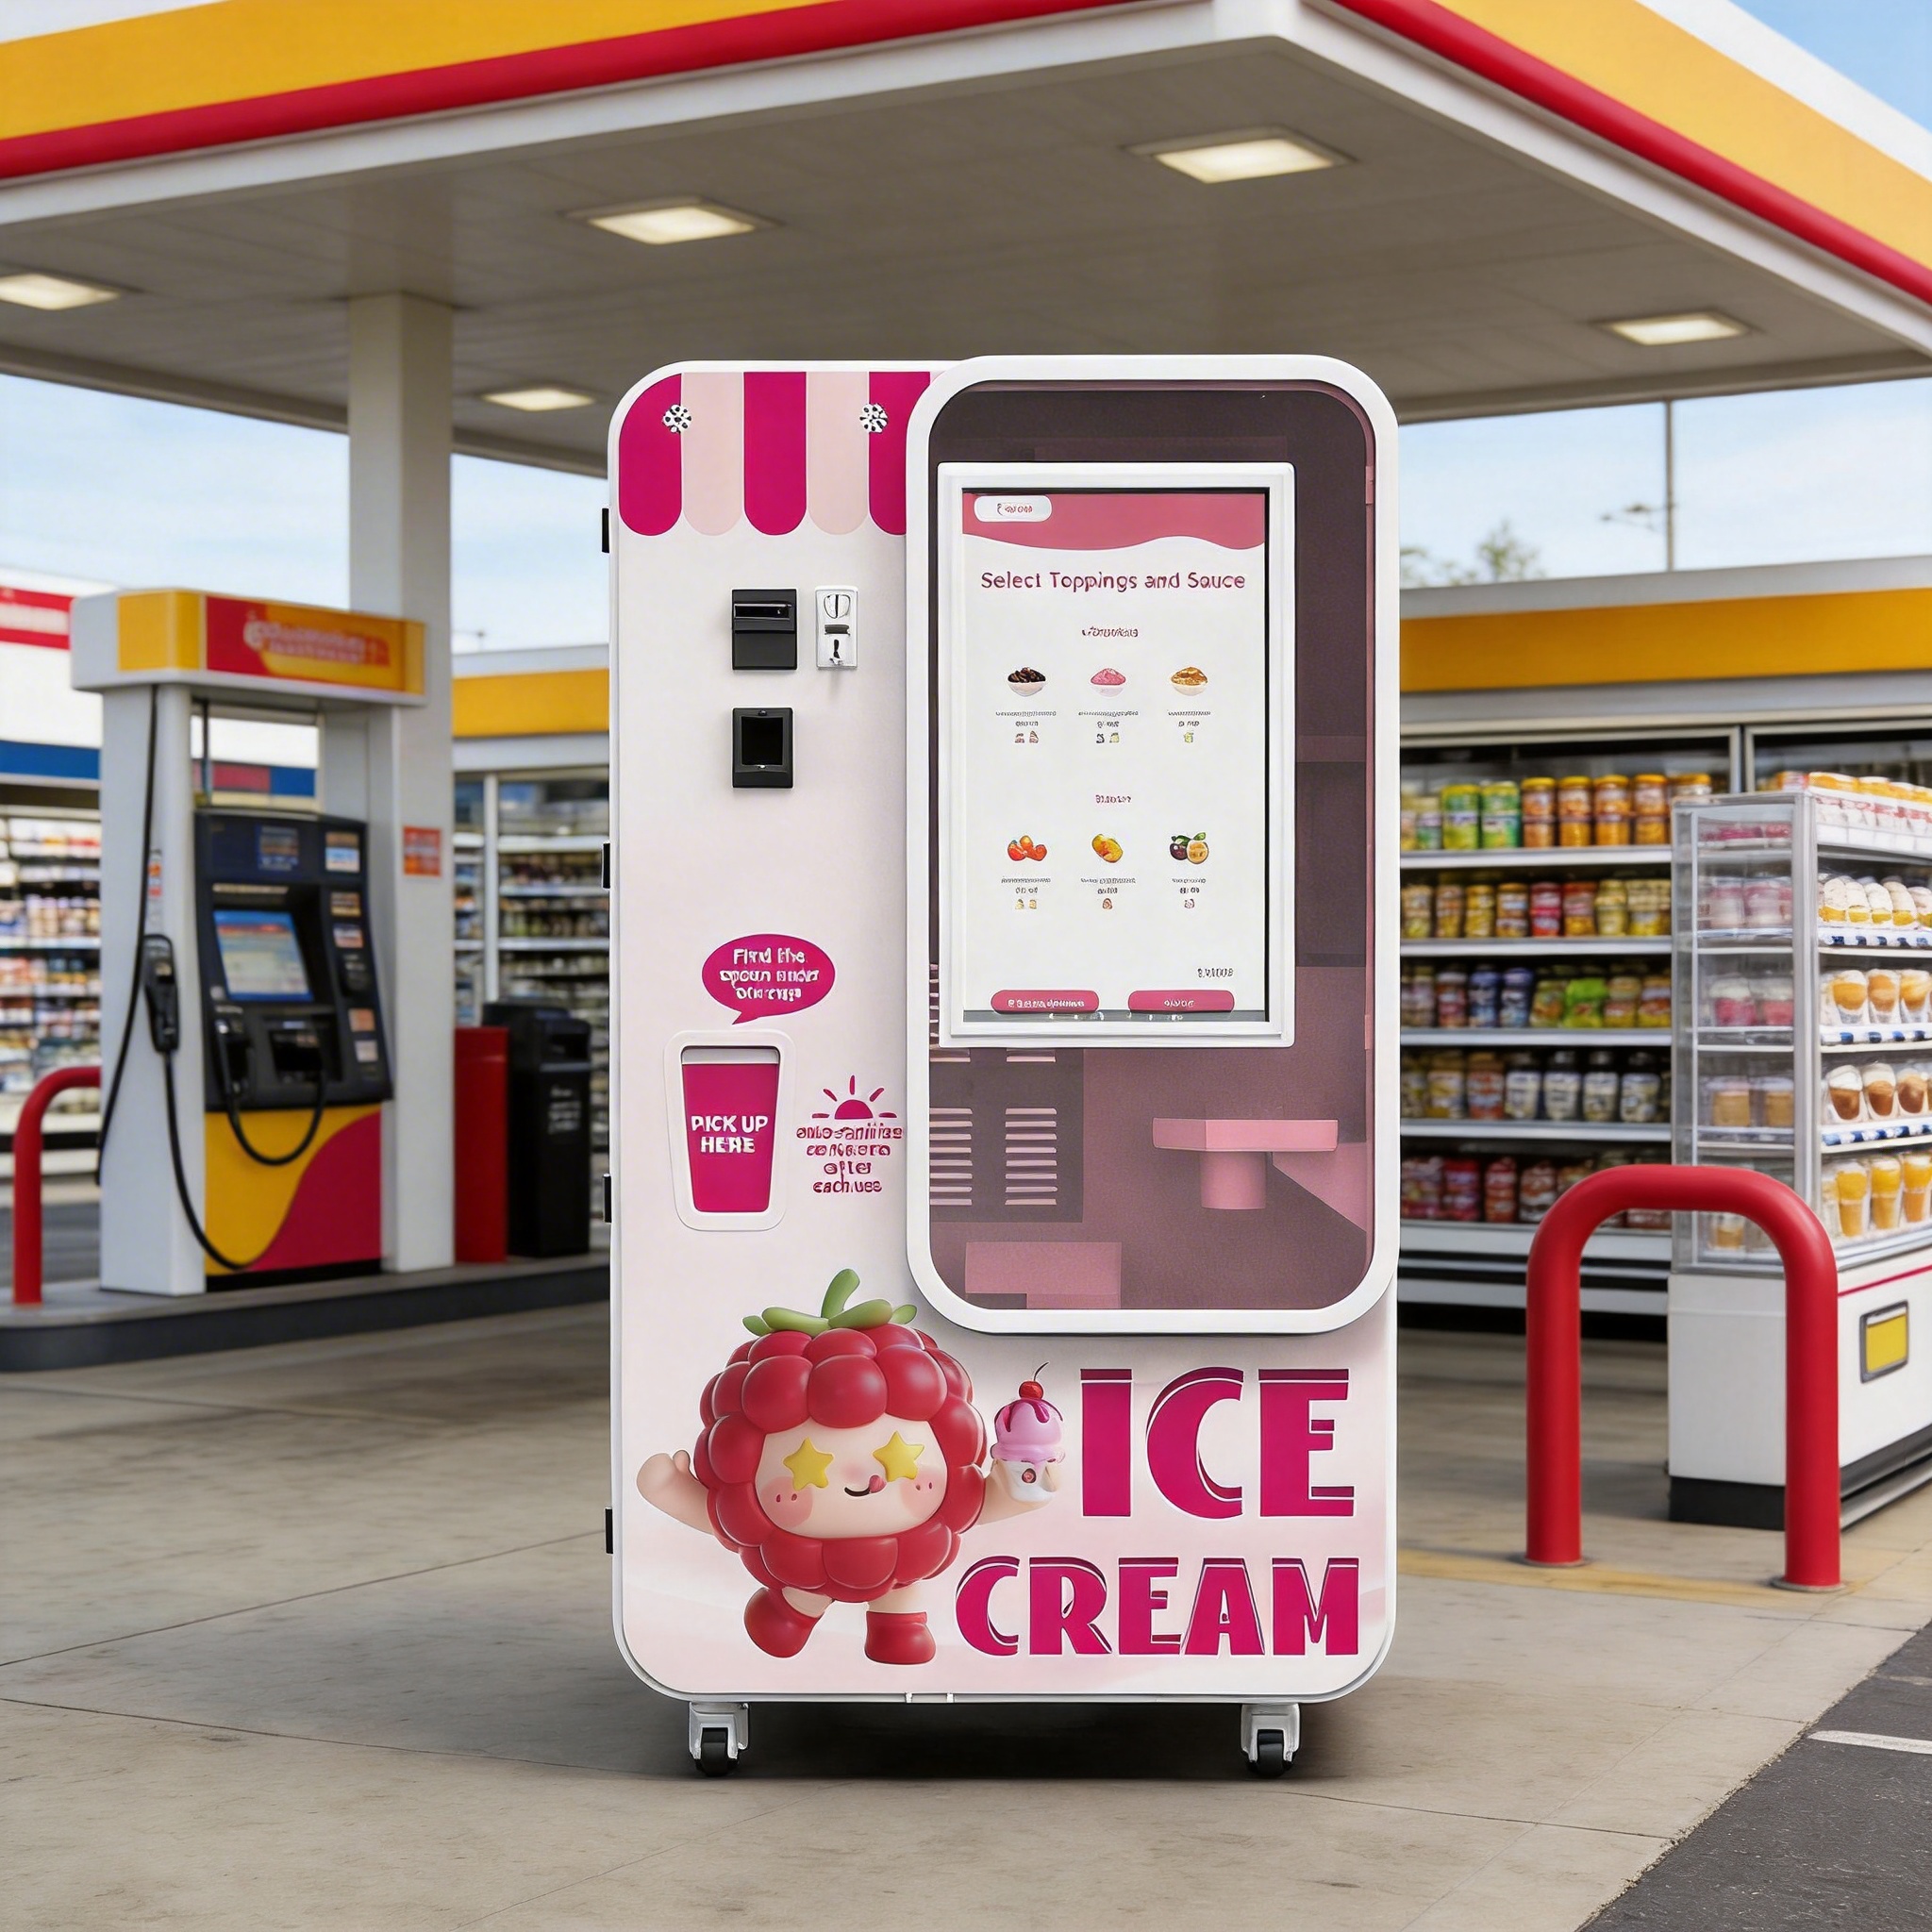
Payment also has to be confirmed for the destination market. Cards, NFC/contactless, QR payments, coins, bills and compatible local wallet solutions may be available depending on configuration, but MDB capability does not automatically make every local terminal compatible.
For a serious project, the payment provider should be identified before launch.
4. Build the Financial Model From the Location Up
This is where the business plan becomes useful.
Instead of starting with a desired payback period, start with assumptions that can be traced to evidence.
For example:
| Variable | Illustrative Input | Where It Should Come From |
|---|---|---|
| Relevant traffic | 1,500/day | Site traffic data |
| Conversion | 2.7% | Clearly labeled hypothesis |
| Daily sales | ~40 cups | Calculation |
| Selling price | USD 4.50 | Local competitor research |
| Variable cost | USD 1.80/cup | Recipe and payment model |
| Site cost | USD 1,200/month | Proposed contract |
| Service cost | USD 600/month | Route model |
| Other fixed cost | USD 450/month | Utilities, software, maintenance |
These figures are illustrative planning inputs, not Huaxin customer results.
The important principle is that every major number should come from an external source, a supplier or site quotation, an internal calculation, or a clearly marked hypothesis.
A projection becomes dangerous when assumptions start appearing as facts.
An Illustrative Two-Machine Scenario
Suppose a planning model assumes:
- two machines;
- USD 4.50 average selling price;
- USD 1.80 variable cost per serving;
- 30 operating days;
- USD 4,500 combined monthly fixed and semi-fixed cost;
- USD 42,000 total initial project capital.
The result changes quickly when daily sales change:
| Scenario | Daily Cups / Machine | Monthly Revenue | Operating Contribution | Simple Payback |
|---|---|---|---|---|
| Conservative | 25 | USD 6,750 | -USD 450 | No payback while loss-making |
| Base | 40 | USD 10,800 | USD 1,980 | ~21 months |
| Strong | 55 | USD 14,850 | USD 4,410 | ~10 months |
Again, this is not a customer case, quotation or expected ROI.
Its purpose is to expose how sensitive the model is to demand.
The same machine can move from an operating loss to an attractive spreadsheet result simply because one sales assumption changes. That is why a business plan using 50 or 60 cups per day should explain why that number is realistic at the proposed site before discussing ROI.
5. Calculate Break-Even Before Payback
For an early-stage project, break-even is usually more useful than a five-year forecast.
The standard unit calculation used in business planning is:
Break-even units = Fixed costs ÷ (Selling price − Variable cost per unit)
Using the illustrative example:
Selling price = USD 4.50
Variable cost = USD 1.80
Contribution per serving = USD 2.70
Fixed monthly cost = USD 2,250 per machine
The approximate monthly break-even volume is:
USD 2,250 ÷ USD 2.70 ≈ 833 servings
Over 30 operating days, that is about:
28 servings per day
That number gives the operator something concrete to validate against actual traffic and customer behavior.
If the proposed site cannot reasonably support the break-even volume, changing the payback spreadsheet will not fix the underlying problem.
Cash flow should also be considered separately from operating profitability. Equipment deposits, international freight, import costs, site deposits, initial ingredients, cups, spare parts, insurance and early operating losses may all require cash before the business reaches stable sales.
A new operator therefore needs to distinguish between initial investment, monthly operating cost, working capital and contingency, rather than spending the entire budget on the maximum possible number of machines.
6. Use the Pilot to Replace Assumptions With Data
A one-to-three-machine pilot should answer questions that cannot be settled in a spreadsheet.
Daily cups matter, but they are only the beginning. A useful pilot also records sales by hour, weekday versus weekend performance, conversion, product cost, waste, payment success, refill frequency, cleaning time, downtime and labor per service visit.
This is where the plan starts becoming first-party data.
Suppose the original model assumes 40 cups per day, a certain refill schedule and limited maintenance visits. After several months, the operator can replace those assumptions with actual numbers.
The pilot should also have success criteria before it starts.
Expansion might require sales to remain above break-even, product waste to stay within an acceptable range, payment to remain reliable and refilling or cleaning to remain manageable. Downtime also has to be low enough that the operating model can be repeated without constant intervention.
The first machine is therefore not just testing whether the equipment works.
It is testing whether the business around the equipment works.
7. What Usually Goes Wrong
The most important commercial risk is often still the location.
A technically strong machine cannot indefinitely compensate for low relevant traffic, poor visibility, weak product fit or excessive site cost.
A second risk is underestimated operating friction. Ingredient waste, failed transactions, cup shortages, network issues or repeated service visits may appear small in the original business plan but become expensive across several locations.
Seasonality can also distort early results. A strong first month does not prove that a location will perform the same way throughout the year.
And then there is scaling too early.
An operator who buys several additional machines before understanding the first location's real economics may multiply unresolved problems instead of building scale.
Most of these risks do not require complicated mitigation plans. They require good measurement, realistic contracts, remote alerts where appropriate, basic spare-parts planning and clear rules for when a weak site should be corrected or relocated.
8. From One Machine to a Repeatable Route
Once the pilot produces reliable data, expansion should become more operational and less speculative.
At 1–3 machines, the objective is validation: location, product, price, payment, refill, cleaning and support.
At roughly 4–10 machines, standardization begins to matter more. Service routes, payment hardware, spare-parts planning, consumable purchasing, remote monitoring and operating procedures should become consistent.
At larger fleet sizes, infrastructure starts to matter: local inventory, technical service, staff training, location acquisition, fleet reporting and purchasing efficiency.
A distributor follows a different path because demonstration equipment, sales capability, technician training and customer support may need to exist much earlier.
There is no universal number of machines at which a project becomes scalable.
A better question is whether each additional machine can be added without requiring the owner to reinvent the operating process.
9. Turn the Analysis Into a Working Business Plan
After the research is complete, the formal document does not need to be excessively long.
A practical plan should cover:
Business concept and model
What is being sold, who operates the machines and how revenue is generated.
Target customer and location
Who is expected to buy, where the machines will operate and how candidate sites will be evaluated.
Product and equipment requirements
Product type, production capacity, payment, remote monitoring, cleaning and service requirements.
Location acquisition
How locations will be found, negotiated and rejected.
Financial model
Startup investment, variable cost, fixed cost, selling price, break-even, working capital and several sales scenarios.
Pilot plan
What will be measured and what results must exist before expansion.
Risk and expansion plan
What could invalidate the project and what evidence is required before more machines are purchased.
When contacting a machine supplier, the same discipline helps.
Instead of simply asking for price, provide the country, location type, business model, initial quantity, product category, expected demand, payment requirements, language, certification needs, launch date and potential expansion plan.
That allows the equipment discussion to be built around a real project rather than a generic opportunity.
Frequently Asked Questions
Is an ice cream vending machine business a good opportunity?
It can be viable where customer demand, location economics, product fit and operating capability align. Broader unattended-retail growth is useful context, but an individual project's performance still has to be validated at the location level.
How should I forecast revenue?
Start with measurable relevant traffic, a clearly labeled conversion assumption, local selling price and realistic operating days. Build conservative, base and strong scenarios rather than relying on one sales number.
How long will an ice cream vending machine take to pay back?
There is no reliable fixed payback period. It depends on the initial investment and the actual operating contribution after ingredients, payment, location, service and other costs.
What is the biggest risk?
For many operators, location performance is the largest commercial uncertainty. Weak traffic, poor product fit or excessive site cost can outweigh the advantages of good equipment.
Should I start with one machine or several?
One machine limits capital exposure. Two or three machines can provide stronger comparative data across locations. The right pilot size depends on available capital and what the pilot needs to prove.
When should I scale?
Scale when actual operating data shows repeatable demand, acceptable contribution, manageable servicing, reliable payment, controlled waste and a location model that can realistically be duplicated.
Conclusion
A strong ice cream vending machine business plan does not try to prove that the opportunity will work.
It defines what must be true for the opportunity to work, then tests those assumptions with real locations and real operating data.
Industry growth can justify further research. Machine specifications can define operational capacity. A spreadsheet can show what different sales levels would mean financially.
But the investment decision ultimately depends on whether customers buy often enough, at a price and cost structure that supports the location.
Once that has been proven, expansion becomes a question of replication rather than optimism.
References / Sources
-
NAMA Foundation — 2024–2025 State of Convenience Services Industry Census. Industry data covering U.S. convenience-services revenue and the role of vending within the broader unattended retail market.
-
U.S. Small Business Administration — Market Research and Competitive Analysis. Guidance on evaluating demand, location, customers, competition and market conditions.
-
U.S. Small Business Administration — Business Planning and Break-Even Analysis. Guidance on financial assumptions, business-plan structure, startup costs and break-even calculations.
-
Huaxin product information. Product categories, typical full-size platform production speed and capacity, remote management, cleaning and payment considerations.
References / Sources